Category: video

  • SHOULD I BUY OR LEASE A TESLA? PART 3: It is not black-and-white (because we do not know the future)

    SHOULD I BUY OR LEASE A TESLA? PART 3: It is not black-and-white (because we do not know the future)

    In my last post, I showed that the total cost of buying a Tesla with a loan (or cash) is easy to figure out. However the final value is critically dependent upon one thing: the depreciation of the car when the owner sells it. Unfortunately that quantity is uncertain, because it has not happened yet…

  • SHOULD I BUY OR LEASE A TESLA? PART 2: Total loan cost (when you are sure about the depreciation)

    SHOULD I BUY OR LEASE A TESLA? PART 2: Total loan cost (when you are sure about the depreciation)

    In a previous post, I calculated the total cost of leasing a Tesla, using my own experience as an example. Before we move on to the buying option, let me mention one important feature of leasing: It has more certainty in terms of total cost. You know what you pay, and you do not worry…

  • How to draw ranking data properly

    How to draw ranking data properly

    A slight problem with drawing data on ranking is how we normally think about ranking. We normally associate “#1” as the best, and “#10” as worse compared to “#1”. But Excel chart typically shows a bigger number in a higher vertical position, and a smaller number in a lower position, as is shown in the…

  • Simulation: It all starts with a coin toss

    Simulation: It all starts with a coin toss

    There are many sophisticated tools dedicated to Monte Carlo simulation, but Excel is powerful enough to handle a variety of simulation needs.  Here are the basic steps of simulation in Excel.  First the users build a decision model in a spreadsheet and specify what are the sources of uncertainty.  Excel can then generate random numbers…

  • Two-way Data Table in Excel is a great tool for sensitivity analysis

    Two-way Data Table in Excel is a great tool for sensitivity analysis

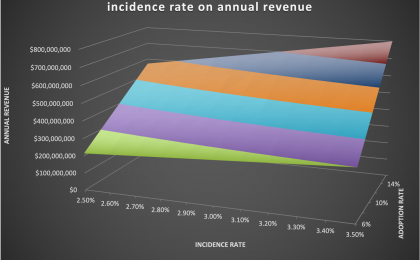
    In an earlier post, I have introduced Data Table as a “secret weapon” to conduct sensitivity analysis. Now let’s go one step further and look at a more advanced type of Data Table called Two-way Data Table. As the name suggests, it offers a way to study the joint effect of TWO variable on the…

  • The Dawn of the Modern Power Grid Started Right Here in Massachusetts (and It was Clean Energy!)

    The Dawn of the Modern Power Grid Started Right Here in Massachusetts (and It was Clean Energy!)

    Electrification is indeed the single great achievement of our society. And yet, I was delighted to find out the modern power grid actually started in Massachusetts, a state I live currently. In the late 1800s, technologies started to converge to build an electrified society. In 1882, Edison’s direct current (DC) system was built in Manhattan.…

  • Measuring the Carbon Footprint of a Supply Chain: 3 Scopes

    Measuring the Carbon Footprint of a Supply Chain: 3 Scopes

    The Greenhouse Gas Protocol has established a set of standards to measure and manage GHG emissions. To me it seems to be the dominant framework in measuring the carbon footprint of an organization and/or a supply chain. The key to understanding the GHG protocal is that it includes three scopes: Scope 1: Any emission that…

  • Zero-Carbon Economy: A Grand -and Necessary – Vision

    Zero-Carbon Economy: A Grand -and Necessary – Vision

    I just watched a video produced by Cambridge University called “The Climate Crisis: Towards Zero Carbon”: Well done, Cambridge! The video first shows that data on historical CO2 levels and temperature makes it irrefutable that the current climate crisis is created by us humans. The video then highlights a few important areas for decarbonization: Energy…

  • Digital Technology and Clean Energy

    Digital Technology and Clean Energy

    I just finished a book titled “Energy’s Digital Future” authored by Professor Amy Myers Jaffe. The book raises a few very important points that are worthy of deeper discussion (and more urgent action): The future of clean energy is digital (i.e. driven by technology). We need more swift and powerful US energy policies to ensure…

  • How to Provide Electricity Access to Rural Africa: An Example

    How to Provide Electricity Access to Rural Africa: An Example

    How to provide electricity access to the remote regions in developing countries is a vast topic, both in terms of its scope and its related research.  Take Africa as an example.  The majority of people in Africa live in rural areas, but more and more people are moving to cities each day. One central question…

  • Why is Chick-Fil-A Picking up Market Share (and Why is McDonalds Testing Robot Fryers and Voice-Activated Drive-Through)?

    Why is Chick-Fil-A Picking up Market Share (and Why is McDonalds Testing Robot Fryers and Voice-Activated Drive-Through)?

    WSJ recently ran an interesting article (and video) on how and why McDonalads is testing using robots to cook and voice-recognition software to take orders at drive-through. The why is simple. To quote the article: “Both technologies are meant to shorten customer wait times that executives acknowledge have grown in recent years. McDonald’s also has…

  • Filter Data Right in your Pivot Table Fields!

    Filter Data Right in your Pivot Table Fields!

    One of the ‘hidden treasure’ in Pivot Table a lot of people do not know about is that you can filter data right in your Pivot Table Fields. This is extremely useful if you already know before you do your Pivot Table analysis that you would like to select and use only a subset of…

  • Sensitivity Study (or Scenarios) with Data Table

    Sensitivity Study (or Scenarios) with Data Table

    In managerial decision making, many time we need more than just an optimal decision. Often we would like to know how my results change if I change my decision in a certain way, or if one of the environmental parameters change. In other words, we want to do what-if analysis. In Excel this is made…

  • PivotTable: Calculated Fields

    PivotTable: Calculated Fields

    Sometime, after you have made a PivotTable you realize you might want to do some further calculations based on the summary results. For example, After getting the total revenue of a company by each division, and the total number of orders for each division, then you might want to calculate the revenue per order -right…

  • Dashboard with PivotTable

    Dashboard with PivotTable

    Dashboard is an effective communication tool to summary and highlight your data and your analysis. Here is an example of an Excel Dashboard that I made with PivotTable (and doughnut charts). Download the Excel file here. How do you make an effective dashboard?  Here are what I consider some key steps: 1- Have a goal.  What…

  • Data Slicer and Timeline are Useful Reporting Tools in PivotTable

    Data Slicer and Timeline are Useful Reporting Tools in PivotTable

    Most of us know how to use a Filter in PivotTable, but do you know that there is an even better tool in slicing data in PivotTable?  Yes, there is, and the name is, well, Data Slicer. Along with the generic slicer that works for every column, there is another slicer that works specifically for…

  • How to Draw a Combo Chart, i.e. Chart with 2 Y-axis, and Change Chart Type on a Mac

    How to Draw a Combo Chart, i.e. Chart with 2 Y-axis, and Change Chart Type on a Mac

    When two columns of data are of different scale, you will need to use a combo chart to plot each column on a separate axis. In the video below, one column is numbers of Plug-in Hybrid Electric Vehicle (PHEV) by country, while the other column is percentage values normalized by country population. As you can…

  • How much gasoline do we American consumers buy each week? An Example of Excel Modeling

    How much gasoline do we American consumers buy each week? An Example of Excel Modeling

    I am a fan of Bill Gates. But the reason I bring his name up in here is because he just demonstrated the power of logical thinking, something very important in Excel modeling. First of all, let’s watch this short video: In the video, Bill first asked an intriguing question: How much gasoline do we…

  • How to Draw a 3-D Chart

    How to Draw a 3-D Chart

    If you have 3-dimensional data, drawing a 3D chart can be very helpful in visualizing how the two variable jointly affect the outcome. In Microsoft Excel, such 3D charts are called “Surface Plots”. Here is a quick tutorial. Please note that your data will need to be in a table (Download Excel file here)in order…

  • Here is Another Example on Why Excel will Never Go Away – Julia Computing

    Here is Another Example on Why Excel will Never Go Away – Julia Computing

    Recently I had a conversation with a colleague who argues that Excel will die because he felt people are switching to other computing environments such as R. While I agree there are more people who are using other computing languages such as R, I do not agree Excel will be out of fashion very soon. …