
In order to qualitatively study range anxiety, one of the first steps is to understand people’s driving behavior. A basic question is: What is the statistical distribution of trip lengths of a typical consumer?
I found the answer on National Household Travel Survey’s website: https://nhts.ornl.gov/. The variable I am interested in is called “Vehicle trips”, i.e., trips by a single privately-operated vehicle (POV), regardless of the number of persons in a vehicle.
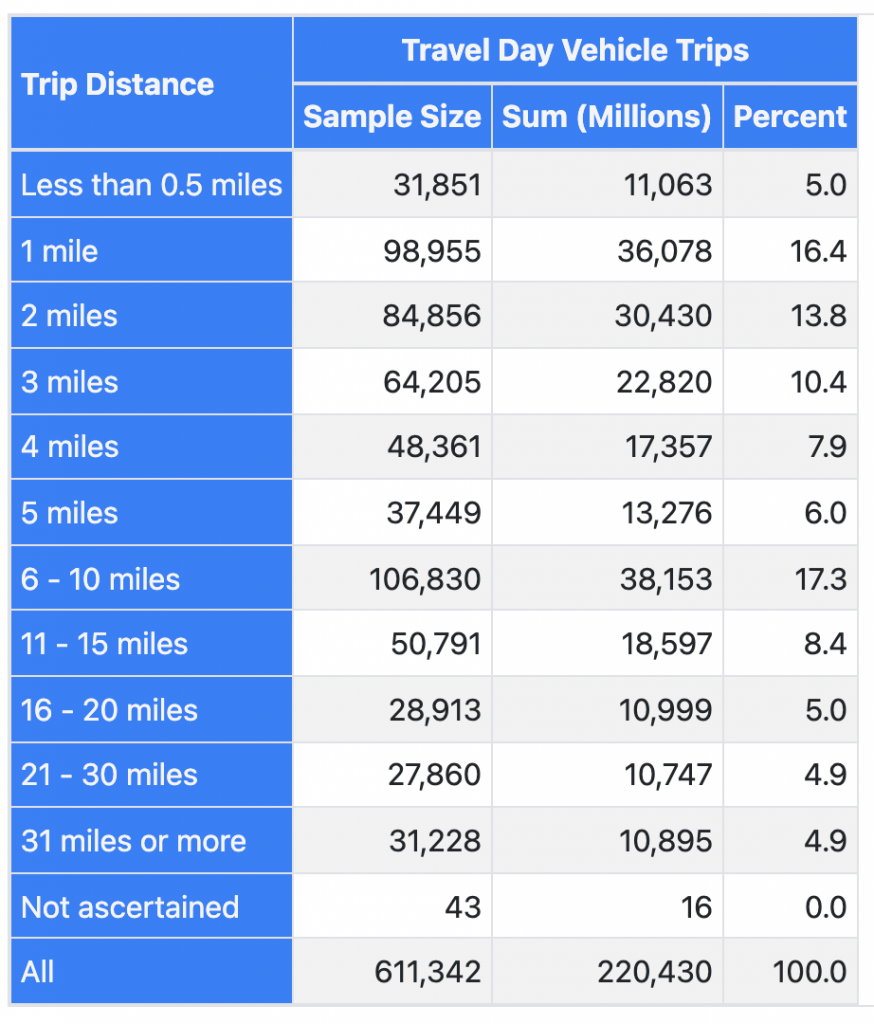
The aggregated data look like this:
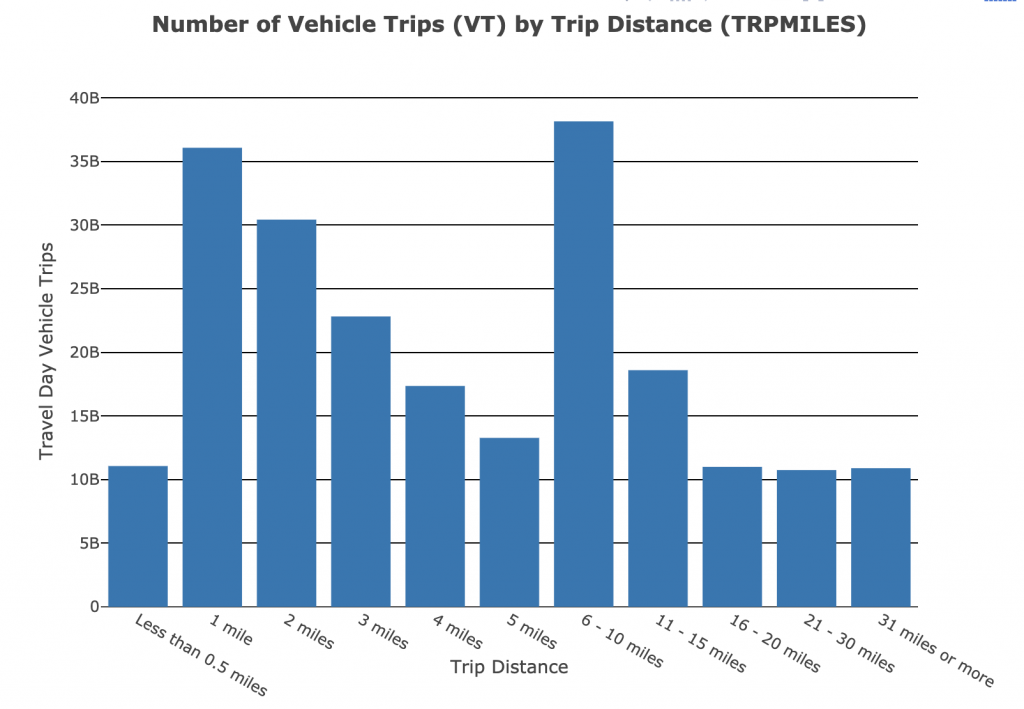
Its frequency chart looks like this:
A couple of observations:
- 53% of the trips are less than 5 miles;
- 95% of the trips are less than 31 miles;
- There seem to 2 modes: 1 mile, and 6-10 miles.
However, it does not seem to highlight the right tail – That is what I am interested in. So in the next article, I will need to download the raw data and find for myself the details in the right tail…
PS. I also found this interesting paper by John Krumm at Microsoft, titled “How People Use Their Vehicles: Statistics from the 2009 National Household Travel Survey“.
Leave a Reply
You must be logged in to post a comment.