-
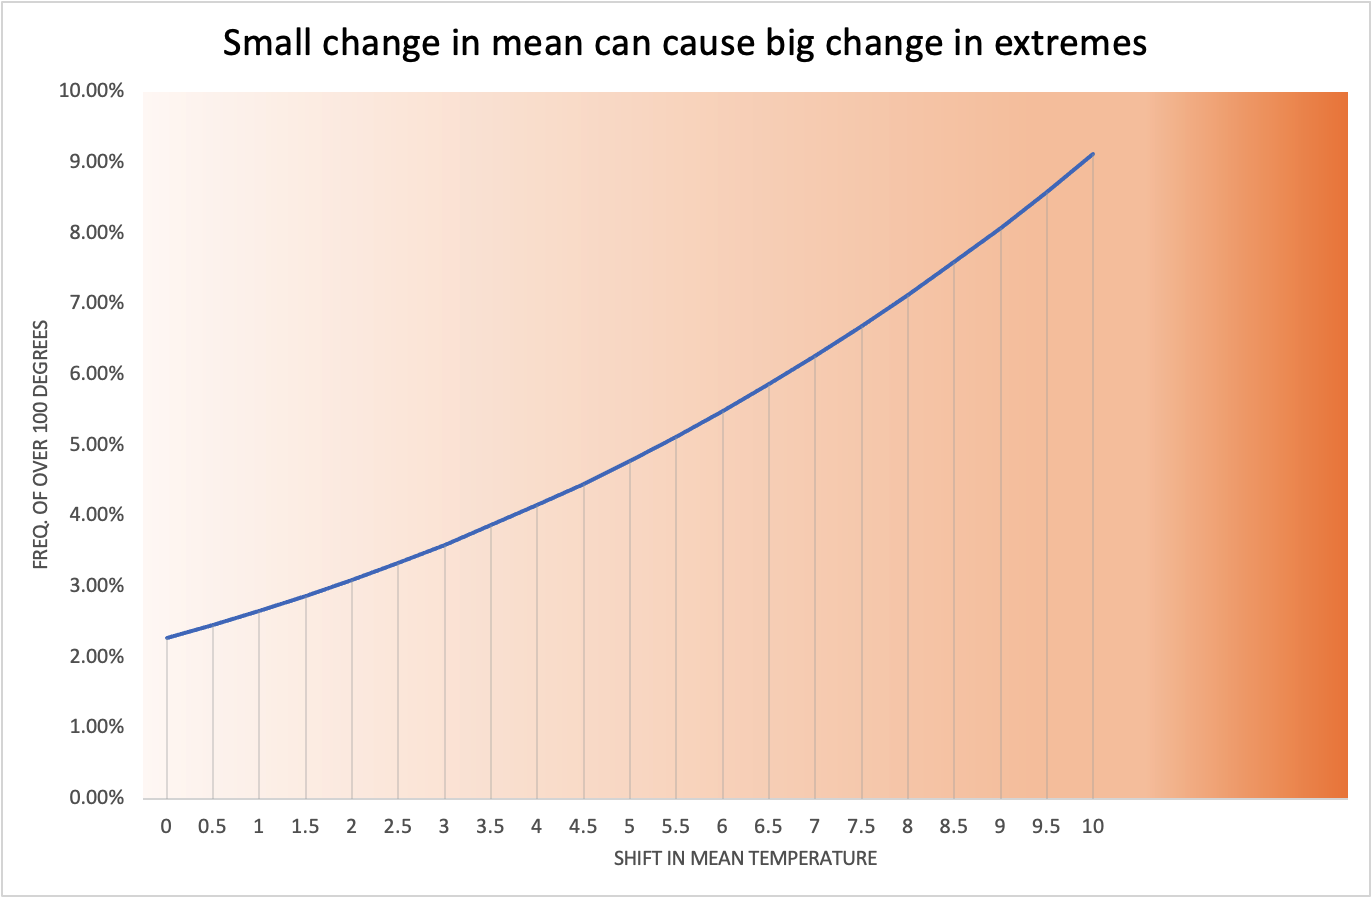
Small change in mean can result in big change in extremes
We have witnessed the recent extreme heat in the US Pacific Northwest. The city of Seattle (one of my favorite cities!) set a new record for the highest temperature ever recorded: 108 degrees. Incidentally the previous record high of 105 degrees was only 11 years ago in 2009. Why do we see extreme weathers more often? I think…
-

AI Is a Game-changing tool for writing code, but humans are still in the drivers’ seat (April 2025)
As I am writing this in mid-2025, AI has become a common byword of today’s world. It seems that everything just tastes better with AI. Without AI everything tastes bland. Moreover, AI will eat the world. But recently I gained some personal experiences which convinced me that while AI will be more and more useful…
-

Democracy is walking a fine line
This is not a political post arguing for one side or the other. It is me trying to observe and make sense of the ongoing drama happening between the federal government and high education institutions.
-
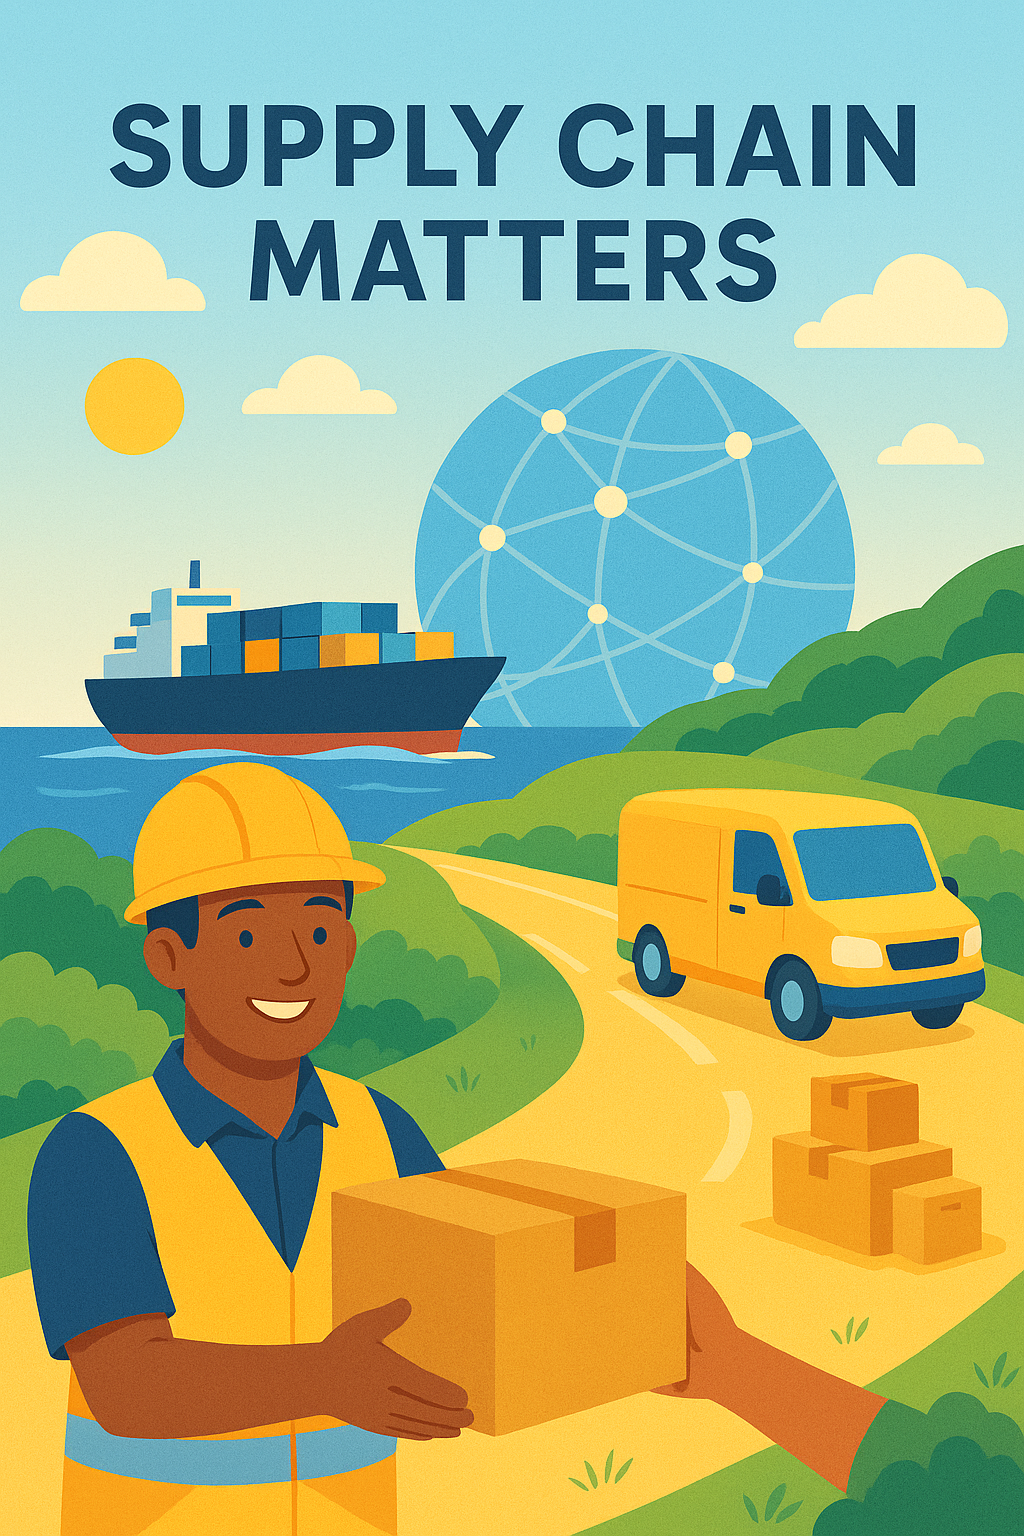
Supply Chain Woes Turns Out to be the Main Culprit of COVID-era Inflation
Inflation can occur when too much money chases too few goods and services, but it can also result from supply disruptions, rising production costs, or global economic shocks. It suggests that inflation can come from either the demand side (a surge in demand or money), or the supply side (a shortage of supply). So here…
-

The Tariff Game will Most Likely Benefit the US in the Long Run; Short-term Pain not be Ignored
It seems that everyone is hurting from the ongoing tariff wars. But I believe the US will emerge as the winner very soon, even though its citizens will have to bear some of the negatives in the shorter run. My belief is derived from three key facts: (1) The US remains the largest and most…
-
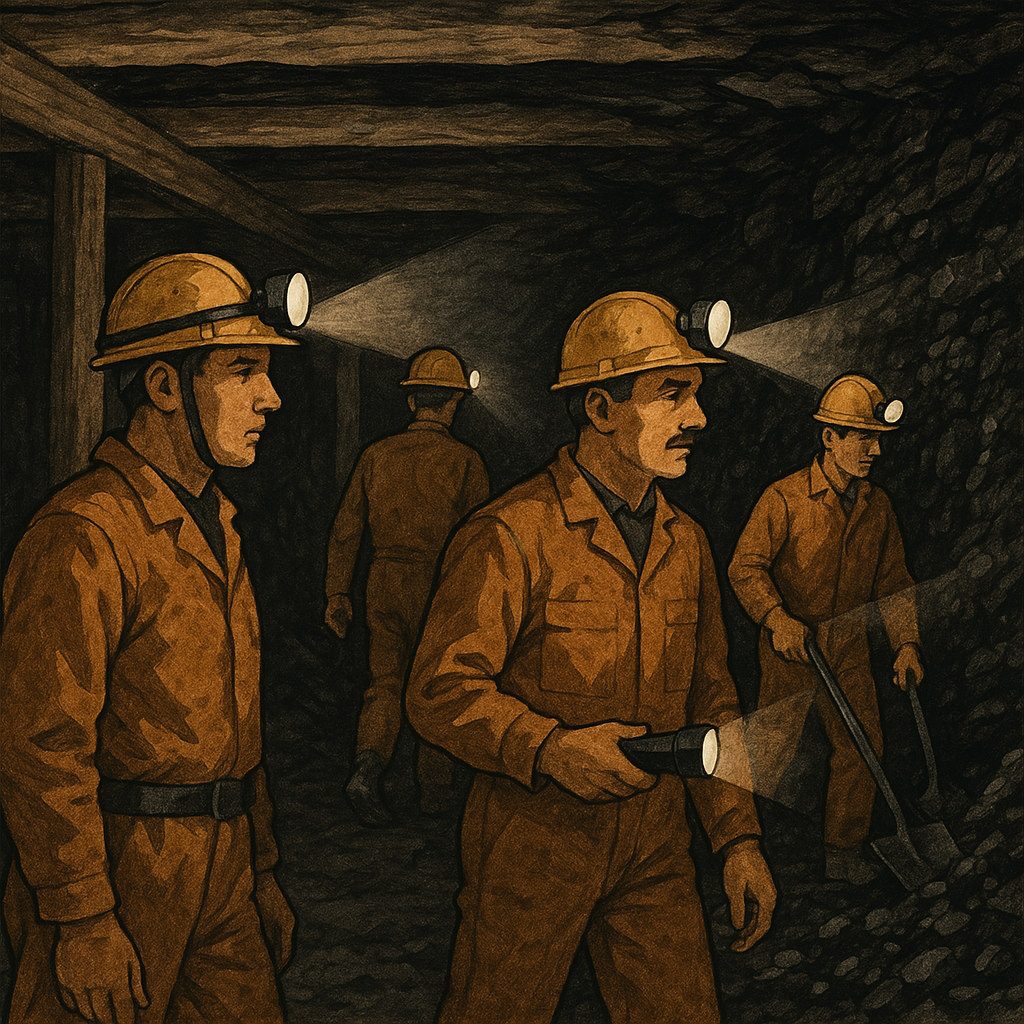
Dissecting a Coal Mine Exploration Target Report… using a Podcast?
There are many ways to use AI to analyze a technical report, but… with a Podcast? I recently tried this feature with Google NotebookLM, and the result is quite impressive. I recently received a Rare Earth Element (REE) exploration report from a mining company. The company essentially drilled hundreds of test holes and measured the…
-

(Arts and AI Series) The Entropy of Creativity: A Revolution or the Decline of Human Creativity?
AI and arts – it is such a vast and fascinating topic that I intend to keep writing about this. Let’s see where I will go with this. This topic fascinates (and worries) me because arts are the souls of human beings. Without art, we lose one of the most important markers as a unique…
-

To Straighten a Bent Stick, You Must Bend It the Other Way
The above saying is actually from an old Chinese idiom. I have thought about it a lot, and have struggled with that too. Finally, I have concluded that it is true. Here are some of my thinkings that help me arrive at the conclusion. Imagine a bent metal tube—perhaps from a bicycle frame or a…
-

Why do we crave for speed?
I am writing this at a ski place in New Hampshire. The spring sun is warm, and the air is fresh. I am sitting in the rest area directly overlooking the diamond slope where skilled skiers zip down the steep slope with curves and ease. I can imagine how exuberated they must be feeling. But…
-
SOLAH: The 5 Functional Pillars of Every Business
I have always been pondering about how to convey the essence of a business. There are many aspects to a business, and it seems in business schools we tend to either say everything is important, or say a particular area is the most important. To me, that is the wrong idea. My sense is that…
-

How to Know If You Have Made the Right Decision: Insights from Academic Research
Recently I was presented with a very interesting and promising career opportunity. After deliberating for a long time, I decided to turn it down with profuse gratitude. After the decision was made, I cannot help but wonder: Did I make the right decision? So I decided to ask ChatGPT. What I got was surprisingly better…
-

The real threat to American prosperity
Given that I just wrote about the dominant status of US on the global economy, it seems strange that I now write about the downfall of the US. Well, while the US is still ahead, I am also convinced that the danger is real. Financial Times recently published a long article by Daron Acemoglu titled…
-
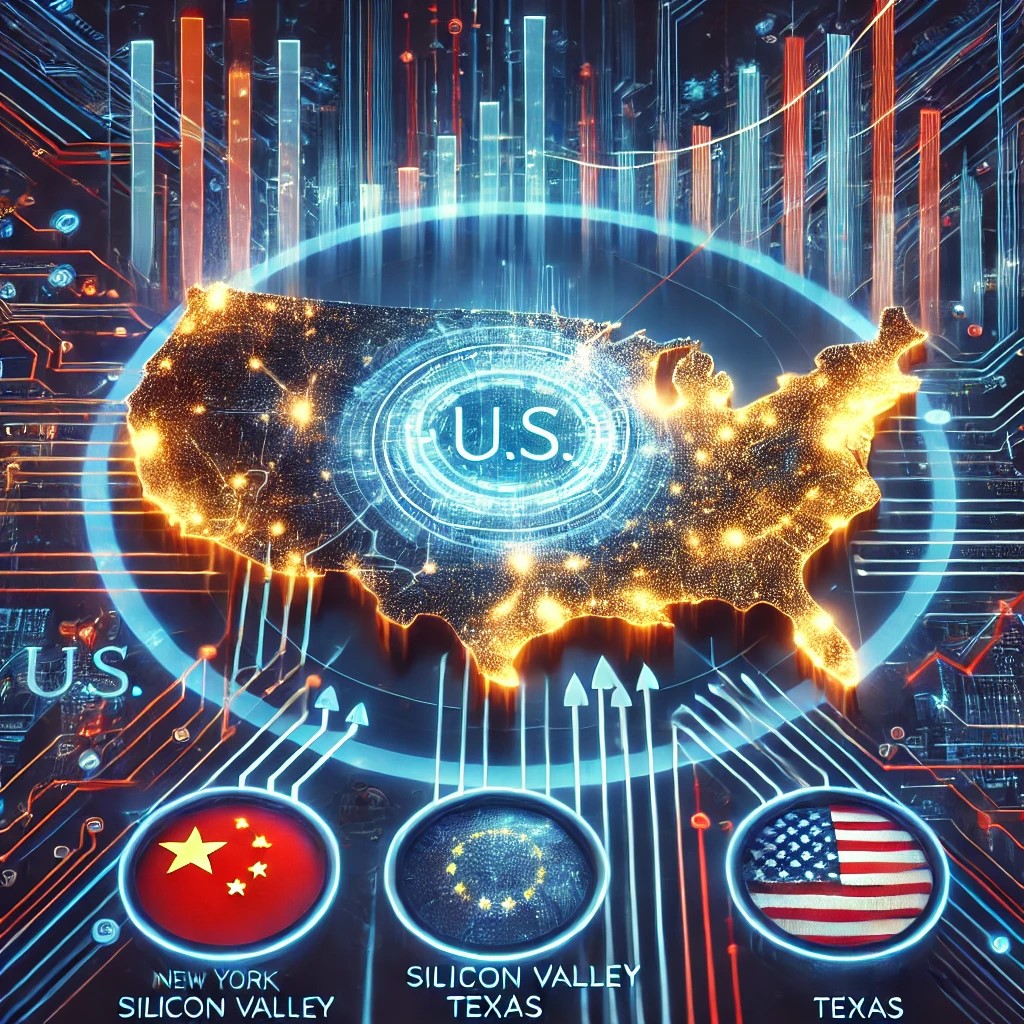
Why the US is still the engine of the world economy
Recently I listened to a podcast between its host Barry Ritholtz and Torsten Slack, chief economist at Apollo, which gave me some fresh insights on why the US economy is firing on all cylinders despite the political turmoil going on. Also, he shed lights on why China is not going to be able to a…
-
What is AI good for? (Feb 2025)
We know AI can do a lot of things, but not many things well (yet). Nevertheless, people including me are using more and more AI, so it is useful to think about what it can do and do well in the real world. Recently I read a WSJ article that summarizes reasonably well the status…
-

Is DeepSeek a hoax?
Today (Jan 27 2025) is a historical day for the AI-related stocks. NVADIA dropped 17% in one day. Broadcom dropped also dropped 17%, Google 4.2%, Microsoft 2.1%. All because of a Chinese AI startup called DeepSeek. We will know more as time goes on, but my initial reaction is skeptism. From what I know about…
-

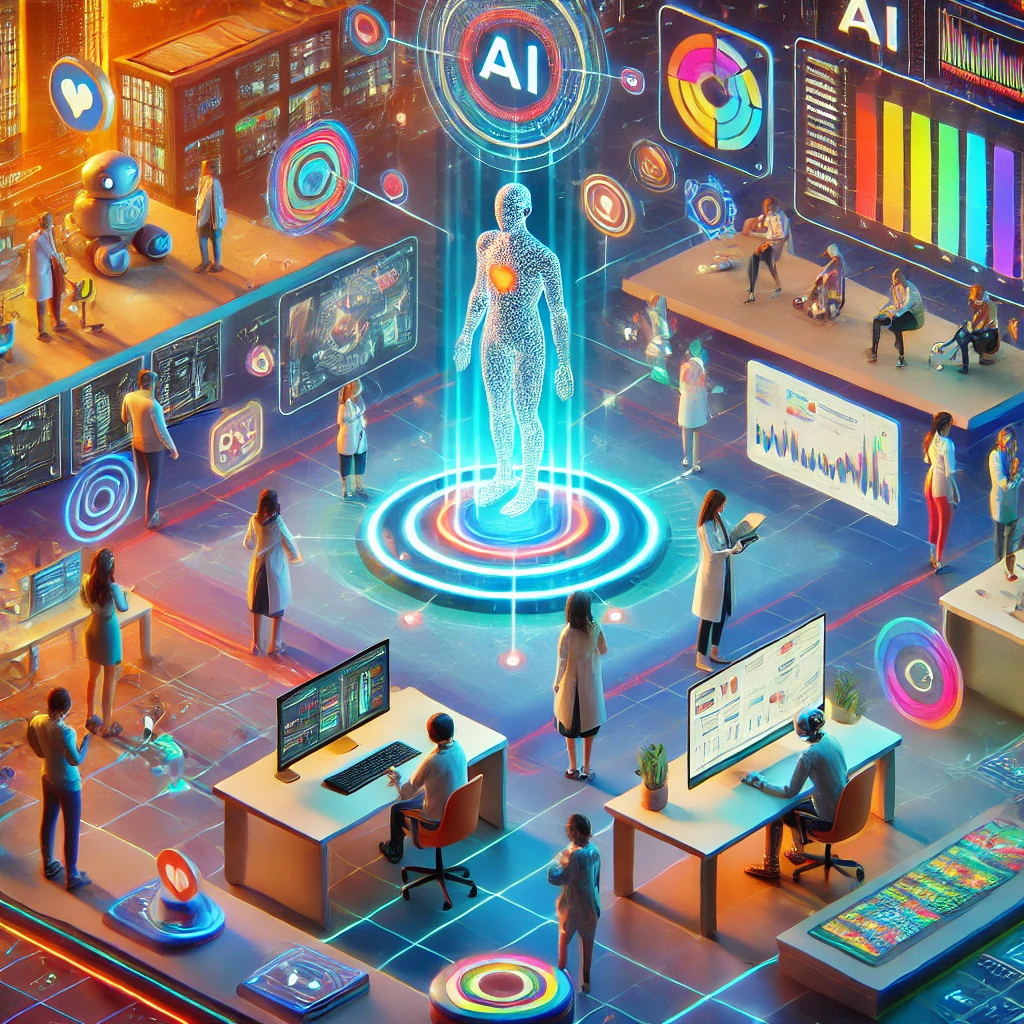
Visualize the AI Ecosystem
AI is all the rage these days. But few people have a clear picture of what the AI ecosystem looks like. I have been thinking about it for some time, and feel that a supply chain perspective can do the job. Not long ago, I had the good fortune of listening to one of Barry…
-
A bold vision of AI Education
Recently I read about an article by Dimitri Bertsimas, who is the Vice Provost of MIT Opening Learning, that describes a vision of what he calls Universal AI: “Universal AI is a platform that involves a horizontal collection of modules covering the fundamentals of AI with an application-oriented process. “ He further details what are…
-

Khanmigo Offers A Glimpse of what AI can do to help future education
I am a fan of Sal Kahn, the person who not only founded Kahn Academy, but also have been working tirelessly to help better education for the past twenty years. The fact that he does not seek a monetary profit is enough for me to respect him. And the fact that he cares for and…
-

2025: A Year of Uncertainty(?) and Growth(!)
It is 2025. What will it bring? It is fair to say that I have no idea. Looking back, who would have thought that the stock market would be one of the best years? I did not. The S&P 500 soared 24%, making 2023-2024 the best 2 consecutive years since 1990s. I remember one year…
-

100% focus = Joy
I stumbled upon this idea while listening to “People I mostly admire”, one of favorite podcasts, where its host Steve Levitt interviewed Dan Gilbert, the famed psychologist professor at Harvard. You can read its transcripts here, and listen to the podcast below: Dan raised this idea that if you turn work into play, then you…
-

The American Civil War was a War on Supply Chains
I love to look at the Early Modern Period and the Modern Age through a capitalist lense. I see the significance of capitalism in almost every turn of historical events when I read the excellent book “Americana: A 400-year history of American Capitalism” by Bhu Srinivasan. After I read the chapter on the American Civil…
Have a question for me?