In managerial decision making, many time we need more than just an optimal decision. Often we would like to know how my results change if I change my decision in a certain way, or if one of the environmental parameters change.
In other words, we want to do what-if analysis.
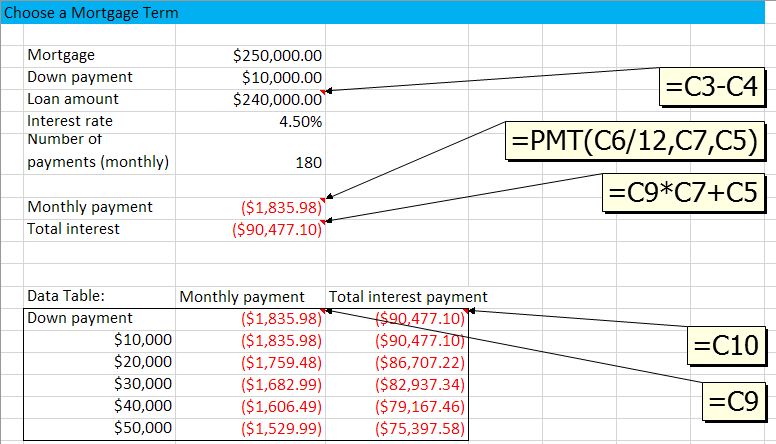
In Excel this is made quite easy with Data Table. You just need to do the following:
– Write down your scenarios, in one column (or in a row);
– Tell Excel what results you would like to see for each of the proposed scenario;
– Tell Excel what variable is driving the scenarios. Excel will then plug each of your scenarios into the variable, and produce your desired results.
See a short illustration video here:
You can download the Excel file here.
Leave a Reply
You must be logged in to post a comment.