Tag: 3D
-
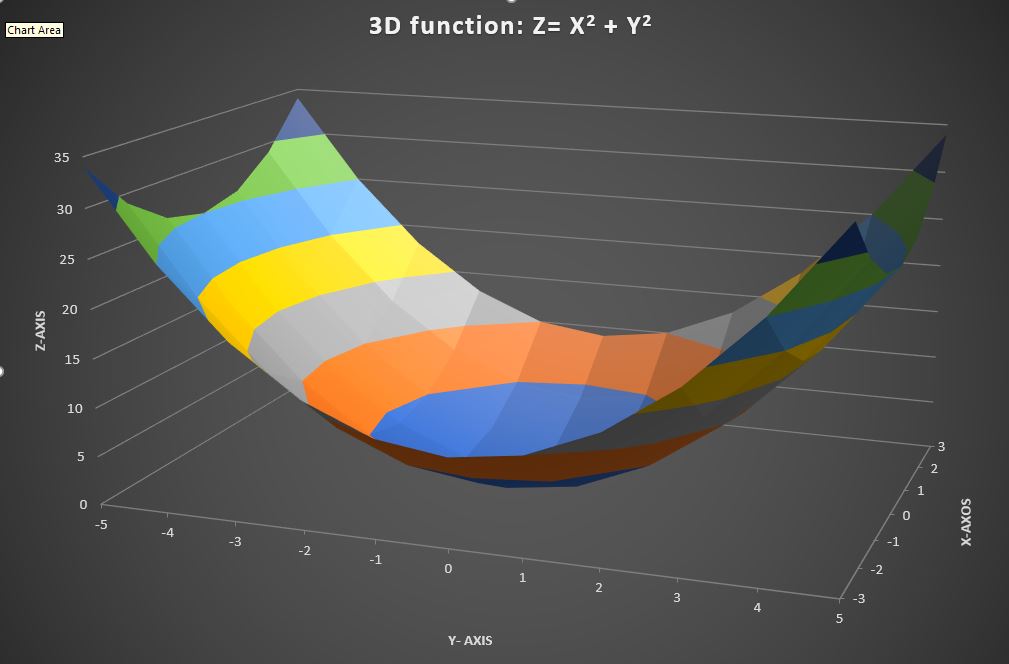
How to Draw a 3-D Chart
If you have 3-dimensional data, drawing a 3D chart can be very helpful in visualizing how the two variable jointly affect the outcome. In Microsoft Excel, such 3D charts are called “Surface Plots”. Here is a quick tutorial. Please note that your data will need to be in a table (Download Excel file here)in order…