We have witnessed the recent extreme heat in the US Pacific Northwest. The city of Seattle (one of my favorite cities!) set a new record for the highest temperature ever recorded: 108 degrees. Incidentally the previous record high of 105 degrees was only 11 years ago in 2009.
Why do we see extreme weathers more often? I think we can now agree that climate change plays a central role here. See a scientific analysis here. But this article is about a simple statistical fact, which is that a relatively small change in the mean of a distribution can result in large change in the likelihood of observing extreme events.
But first, let’s a dynamic illustration by folks at the Climate Central:

Now let’s write a simple Excel model to quantify such changes.
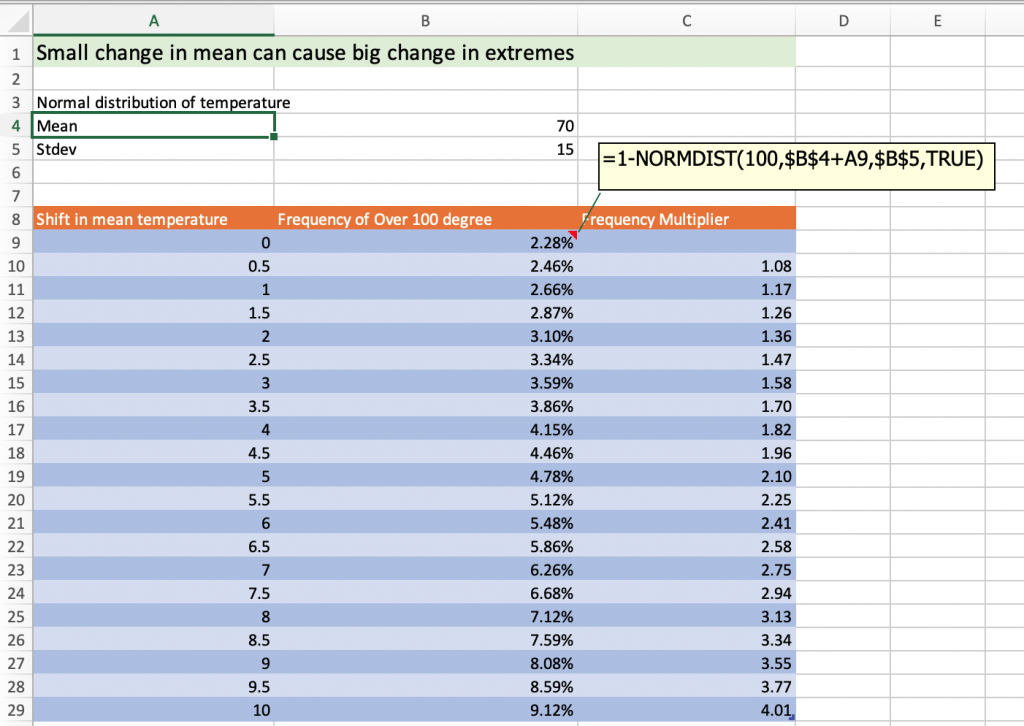
In this model, we assume the temperature of a city in a given time of year follows a normal distribution with average of 70 degrees and standard deviation of 15 degrees. It is then straightforward to use Excel’s NORMDIST function to calculate that there is a 2.28% chance of see any temperature over 100 degrees.
Then, we assume a small change in the mean temperature, due to fundamental changes in climate structures. First by just 0.5 degree, then 1 degree, and 1.5 degrees… until we end at 10 degrees.
The result is quite illustrative. With an increase of just 2.5 degrees in its average, the likelihood of being 100 degrees or above jumps to 3.34%, a 50% increase!
When the mean temperature increases by 4.5 degrees, the probability increases to 4.46%, a 2X jump. We can visualize the change with the following graph:
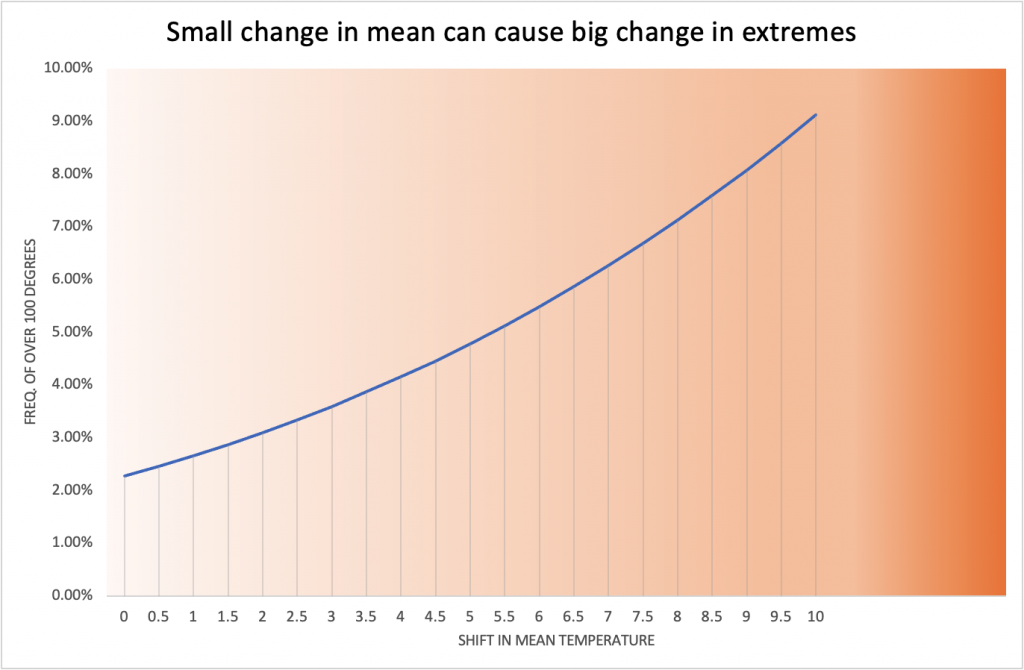
What is important to note is that it is non-linear. In fact, it is increasingly increasing, which means that we are going to have disproortionally more hot days as the climate warms up.
You can download the Excel file here and see for yourself!