Category: modeling
-

Choosing the right fuel (III): Whose perspective?
In this post, I will try to flesh out the perspective of a shipping company whose goal is to reduce its carbon footprint. Let us say there a shipping company that owns and operates deep sea bulk carriers. The following areas are of concern, from the greatest to the least: Fuel-related cost (FC): purchase, distribution,…
-

Port of LA: Storage Space is the culprit?
Recently I read about the saga at the Port of LA. According to Ryan Petersen, the chief executive of logistics company Flexport, the real bottleneck at the Port of LA was actually storage space. The article reported: “In a full 3 hour loop through the port complex, passing every single terminal, we saw less than…
-

Why Supply Chain Delays are Multi-faceted: A Mathematical Explanations (Without the Heavy Math)
Paul Krugman recently penned an excellent article explaining why we see the supply chain snarls in New York Times. It mentioned a number of factors: The US consumers are buying a lot more stuff than before, as a partial substitutions to experiences because of the COVID; The processing capacities at docks and hubs have not…
-

Tesla Lease Mileage Limit and the Central Limit Theorem
I am onto my second Tesla car leases now, so I think I can define another form of range anxiety with my leased cars: Driving over the lease limit. It was actually quite interesting. When I was leasing my first Tesla, I did a rough calculation of my daily driving, and figured that 10,000 miles…
-
SHOULD I BUY OR LEASE A TESLA? PART 4: It all comes down to your apetities towards risk
Having used multiple spreadsheets to illustrate the dollars and cents around the leasing vs buying option, let me conclude. It depends on how you view uncertainty. As I said earlier, one big advantage of leasing is its clarity and certainty. You know how much you are going to pay, and that is how much it…
-

SHOULD I BUY OR LEASE A TESLA? PART 2: Total loan cost (when you are sure about the depreciation)
In a previous post, I calculated the total cost of leasing a Tesla, using my own experience as an example. Before we move on to the buying option, let me mention one important feature of leasing: It has more certainty in terms of total cost. You know what you pay, and you do not worry…
-
Should I Buy or Lease a Tesla? Part 1: Leasing Cost
Recently I read quite a bit of discussion on “Should I buy or lease a Tesla?”. I do not want to weigh in on which side I take, as I know it is not just about numbers. People value things differently. So here I would just focus on the monetary cost side. When it comes…
-

Simulation: Is demand equal to sales? (Part II, and why is there a Loch Ness Monster?)
In an earlier post, we discussed the difference between demand and sales using a simulation exercise. Now the question is: How can we visualize the difference? To start off, we all know the shape of the normal curve (in the example we discussed the mean is 600, and its standard deviation is 100): However, if…
-
Simulation: Is demand equal to sales? (Part I)
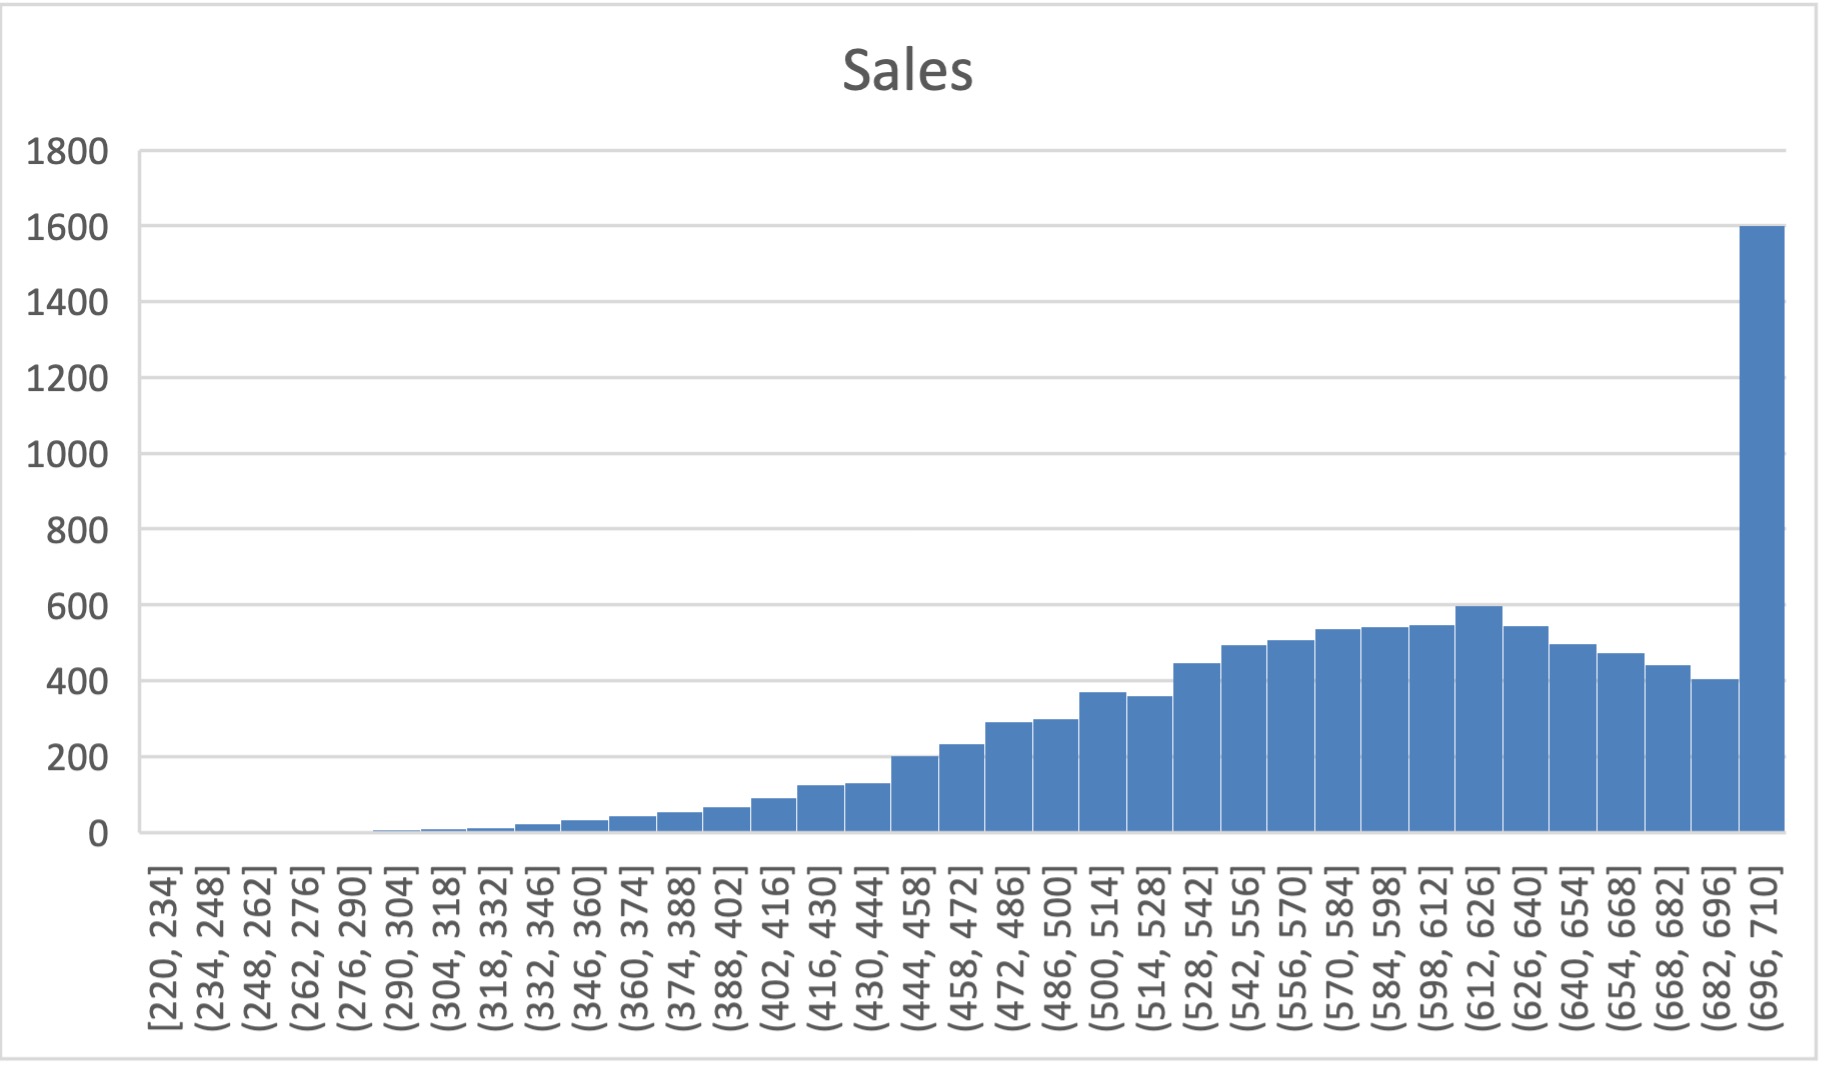
Consider the following problem: Suppose at a retail store the annual demand for a toy is a random variable with a normal distribution of N(600, 100), i.e., with mean of 600 and standard deviation of 100. Simulate the distribution of sales if 700 units of such a toy is ordered. What is the expected sales?…
-
Modeling Driving Distances (3)
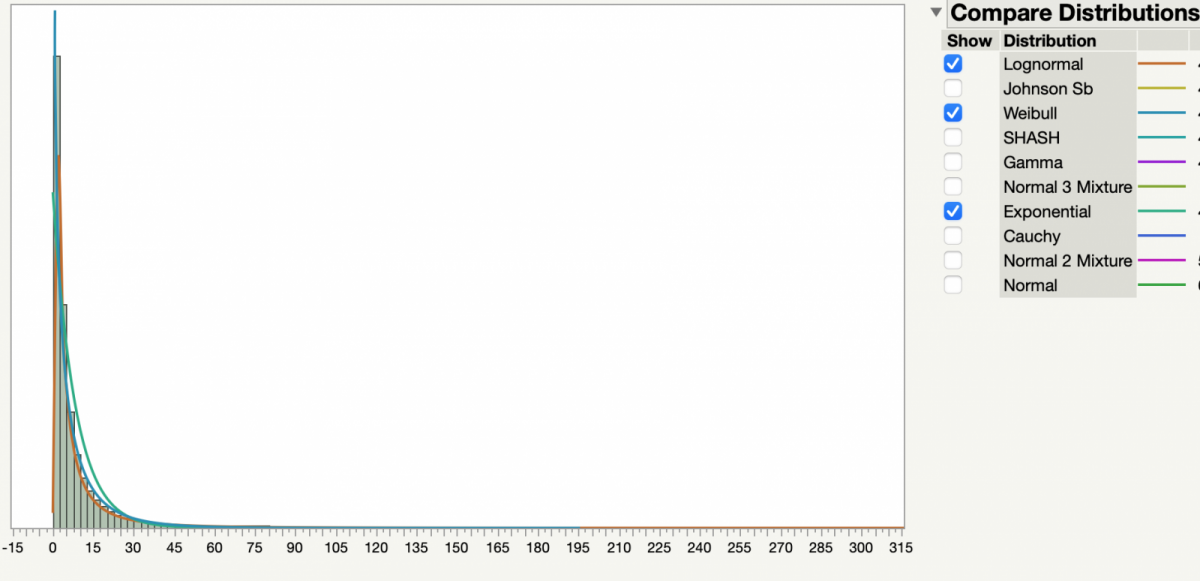
Since my last post on using NTHS dataset to fit people’s driving distances, I have made some further modifications: (1) There are some very large TRPMILE data values, in the order of 1000 miles. While there are most likely valid data – After all, people do travel that far – I realize that this is…
-
Range Anxiety for Electric Vehicles (EV) – Part I
To a consumer who is considering purchasing an EV, range anxiety is a real thing, even though the name may suggest it is psychological. Moreover, range anxiety has multiple dimensions. People use cars for three types of trips: Commute, excursions (i.e., short errands), and long trips. Let’s take a close look at each. Daily Commute…
-
Sensitivity Study (or Scenarios) with Data Table
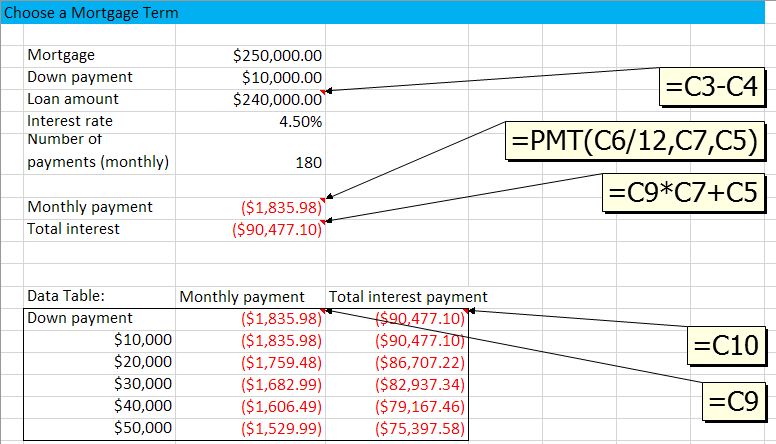
In managerial decision making, many time we need more than just an optimal decision. Often we would like to know how my results change if I change my decision in a certain way, or if one of the environmental parameters change. In other words, we want to do what-if analysis. In Excel this is made…
-

How much gasoline do we American consumers buy each week? An Example of Excel Modeling
I am a fan of Bill Gates. But the reason I bring his name up in here is because he just demonstrated the power of logical thinking, something very important in Excel modeling. First of all, let’s watch this short video: In the video, Bill first asked an intriguing question: How much gasoline do we…
-
Chance of Nothing Happening? The Power of Joint Probabilities
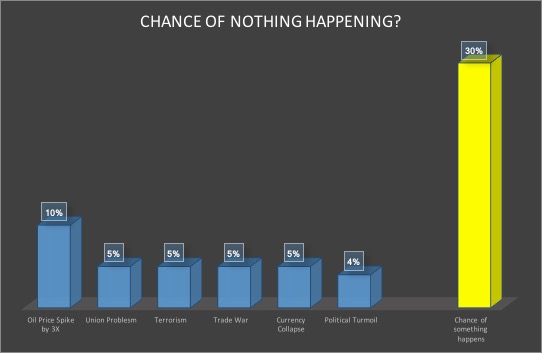
Yesterday, as I was reading a book about Blackstone, the famed asset management company, something caught my attention. It was about how one of its executives describing evaluating risks in a potential deal: ” You say there’s a chance there’s a major terrorism event blowing up an airline, but that happens once in twenty years,…
-

All Great Boston Area Towns Benefitting from the Housing Boom? Not Quite So
I recently came across an interesting summary table on median condo prices in the Great Boston area (re-created in Excel below; original data from the Boston Magazine, whose link is here) Median prices probably are probably a good measure instead of averages because they might be skewed by very expensive high-end buildings. Nevertheless I was…
-

How to Estimate Uber’s Monthly Ride Volume in 3 steps
Many of my students are heavy Uber users. So I asked them one day, “What do you guess should Uber’s monthly ride number be in the US?” It turned out to be a fascinating exercise, especially in light of logical thinking. A good logical-thinking starts from the bottom, and has the following three steps: Step…
-
How to Draw a Pareto Chart?
Pareto chart, put simply, is a sorted frequency chart. It is used mainly for identifying the most frequent occurrences in a collected sample. Some business-situation questions can be answered by a Pareto chart include: — What are the most common service duration in a process? — Which aspect do our customers like best? —…
-

Data Table is a Secret Weapon in Excel Modeling and Analysis
Scenario analysis (also called What-ifs) is an indispensable part of business decision models. What is demand is only half of predicted? What if conversion rate is 50% higher? What if we drop our inventory by 1000 units? Once a decision model is built, it helps decision makers to test outcomes under various scenarios. Excel provides…
-

“That’s twice the size of Texas. They may never find us.”
Wait…what’s this? You might be wondering. What does it have to do with Excel modeling? Let me explain. First of all, this is a quote from the move Cast Away. Its main character Chuck, a Fedex executive, was washed onto the shore of a remote island after his plane was disintegrated in mid-air. …