Paul Krugman recently penned an excellent article explaining why we see the supply chain snarls in New York Times. It mentioned a number of factors:
- The US consumers are buying a lot more stuff than before, as a partial substitutions to experiences because of the COVID;
- The processing capacities at docks and hubs have not increased much;
- When those supply chain nexuses are at almost full capacity, small disruptions can snowball into large delays.
Here I am not going to add anything new here – You should read the original article which I highly recommend – but I am just going to add some quantification to the above points with the aid of an Excel spreadsheet. But first some mathematical facts.
I am going to use results from queueing theory, a field that researchers have worked on for decades. The Port of Los Angeles, for example, can be viewed as a queuing systems with a number of parallel servers (i.e., docks). Since we do not have the exact data on its demand and service distribution, we are going to use fairly general distributions. The downside is that for such general distributions, there is no very precise closed-form formula, but a closed-form approximation has been proven to work very well. This approximation states the following. For a queueing system such as the Port of Los Angeles with
- The average interarrival time of a days (i.e., one ship comes every a days), and therefore demand rate of 1/a ships per day. This is the measure of demand.
- The average service time of p days (i.e. it take p days to unload a ship). This is the measure of process speed.
- There are m docks working in parallel. Therefore the total process capacity of the facility is p/m days.
- Its utilization rate, a measure of “busy-ness” is defined as (demand rate/service rate), which is (1/a)/(m/p)= p/(am) ;
- Both the the interarrival and service time has variations. A common measure of the degree of variations is called the coefficient of variations (CV), which is defined as the ratio of its variance over its average. Denote CVa and CVp the CVs for interarrival and service times.
The waiting time for a ship to get serviced can be approximated by the formula
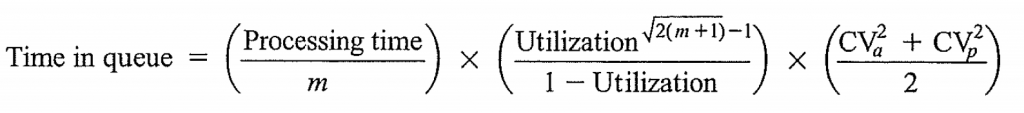
Now, time to add empirical data for those values. I did a quick research and found those numbers, with the information source cited:
- a: The port of LA disclosed that had about 1600 vessel arrivals in 2020. We will assume a majority of them are container ships. That is about 4 ships per day. But we also know that arrivals have dramatically increased in 2021. So we will use a=1/4=0.25 to begin with, and will use a smaller a to simulate faster arrivals. We will also assume there is less variance in arrival, so V(a)=0.1.
- p: Normally 3 days according to this discussion at Quora. This also has a very high degree of variability. This vessel activity document in Q3 2021 shows that 6-9 days are not that rare either. So we will say p =3, and V(p)=1 in normal times, but it can be as high as 4 days in bad times.
- m: Port of LA has 82 ship-to-shore container cranes (Source: Port of LA). They also typically use 5 cranes to a ship (Source: LA times) . So that means they can probably handle 16 ships at the same time at full capacity. (This vessel activity document seems to confirm that there were about 15-18 ship at birth at any given day)
OK we are ready to simulate. With a=0.25, p=3, m=16, V(a)=0.1, V(p)=1. Our estimated waiting time is 1.5 days. Not bad. Also it confirms that during normal times, waiting is minimal.
Now, the interesting part. Since the pandemic, a few things happened. First of all, demand increased. We can use a faster a to represent that.
Secondly, the port of LA has higher variability in its processing capacity.
The joint effect of these two factors alone is dramatic:
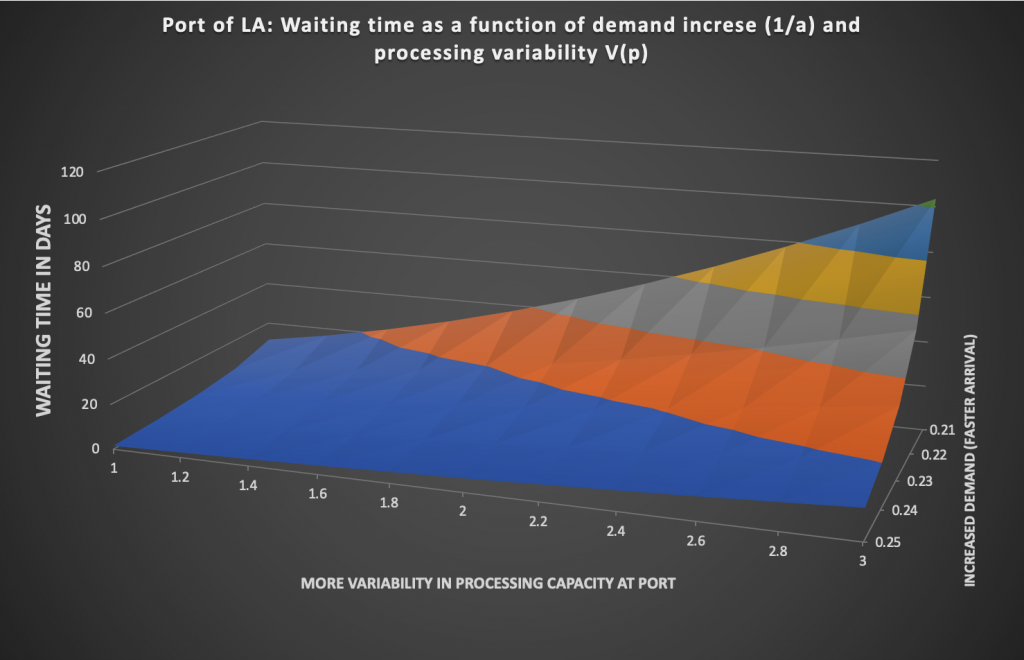
In the graph, demand increased from 4 ships (a=0.25) to about 5 ships (a=0.21) a day, which is pretty close to what is happening in magnitude. Even with minimal variability of V(p)=1 day, the waiting time has already increased to 11.6 days. Now with V(p) doubles to 2, the waiting time will be 46 days, which is pretty much what is happening right now!
You can download the spreadsheet here and see for yourself.
What is the takeaway? Such delays happen non-linearly, which is why people are often caught off-guard. Secondly, when the system is also pretty busy, a little more stress can induce very big change (compare the curves when a=0.25, and when a=0.21, for example).