Category: visulization
-

Visualize the AI Ecosystem
AI is all the rage these days. But few people have a clear picture of what the AI ecosystem looks like. I have been thinking about it for some time, and feel that a supply chain perspective can do the job. Not long ago, I had the good fortune of listening to one of Barry…
-

EV has come a long way but US is falling behind
I came across the data of EV stock at the country level from the IEA website. While it is informative, it does not have any map visualization, which is quite easy to do with Excel. So I just did that. The above is the one on EV stock in percentages by country as of 2022.…
-

Top 10 Bio-pharmaceutical Regions in the US by Numbers
The recent COVID-19 pandemic is a testament how incredibly important our biopharmaceutical industry is. It was able to produce vaccines in a record amount of time that saved million of lives. In the past decades, there have been a surge of innovation (and investment) in the biopharmaceutical industry in the US. To put it into…
-

EV prices 2022 (I): The Distribution
How much more expensive are electric cars these days, compared to gasoline cars? Most articles are this topic compare the averages, and some look at the box plots. But I would argue that the best way to compare is to look at the entire statistical distribution of the two. I looked around on the Internet,…
-
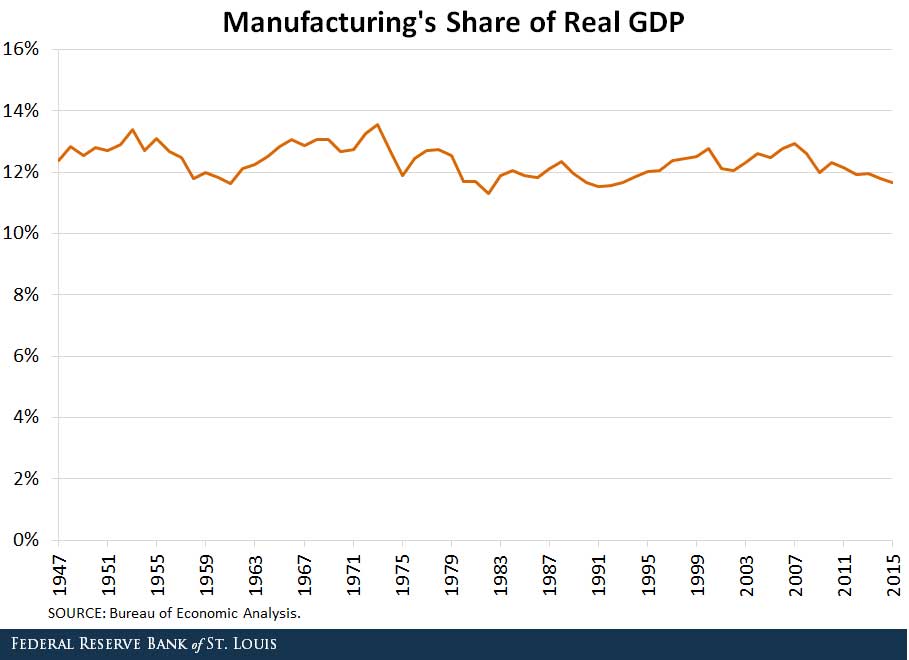
The Multiplier Effect of Manufacturing: Where Jobs Come From
These days whenever we talk about manufacturing, the number 1 thing that came to people’s mind is that it is shrinking. And that it is a small pie of an economy. The truth is that according to the US government definition of manufacturing, it has been been sitting steady at around 12% of Real GDP…
-
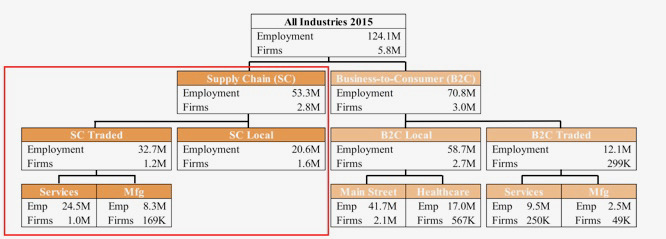
How large is the supply chain economy? The answer may surprise you
Recently I have been working on a book about the “supplychainification” of economies around the world – If you have never heard about the word “supplychainification”, no worry. I have not either. My collaborators and I invented it, and I will explain it in a separate article. In here, I answer a even simpler (but…
-
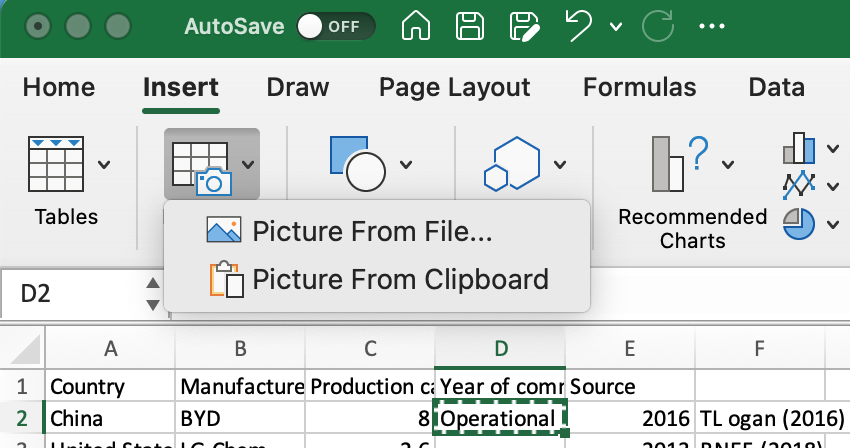
Excel Trick: Import Data From a Picture!
Have you ever looked at a table in a PDF file (or a picture) and wanted to import it into Excel? This video tells you how! As shown in the short video, this function is not perfect – but its usefulness far exceeds its imperfections! You may still need to edit the imported table a…
-

EV in 2022 and Beyond: More Good News, but Uncertainties Too
Recently I was asked to reflect a little on the recent EV movement, so I dug a bit on the latest statistics. 2022 is not over yet, so the latest number we have is from 2021. I was encouraged to find that while everyone was focusing on the COVID in 2021, EV sales actually nearly…
-
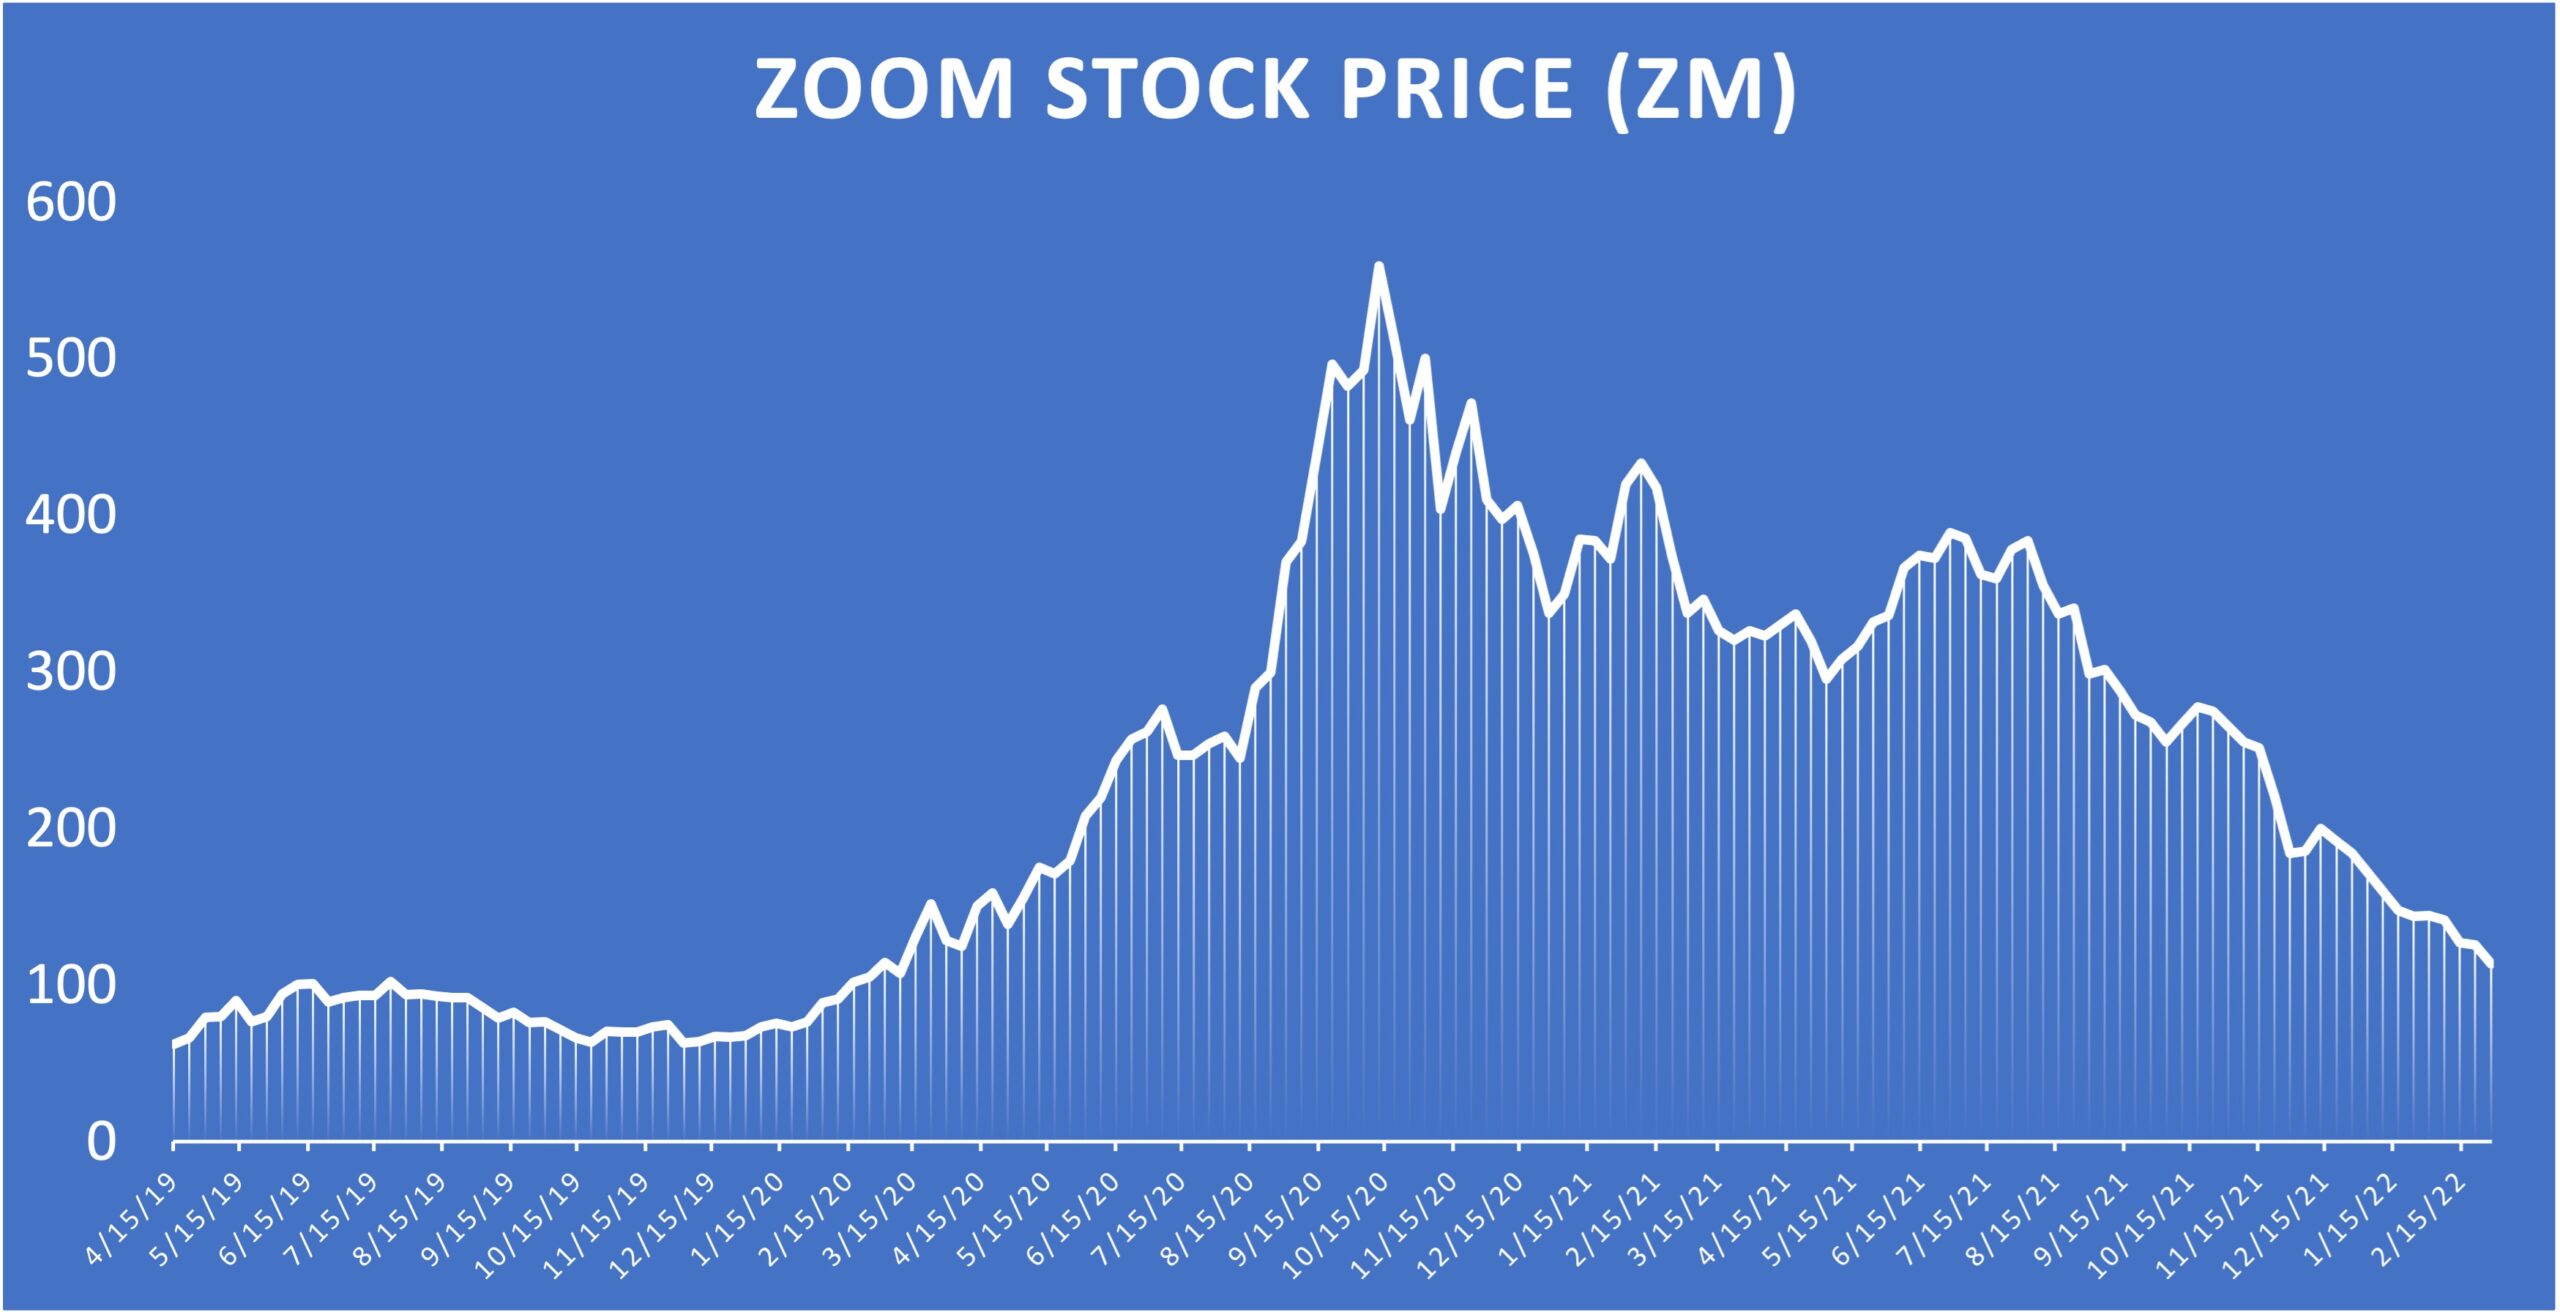
What will happen to Zoom?
This is just a reflection of evaluating the long-term prospect of a company. As we all know, Zoom has been a huge successful company, boosted by the good timing of the covid pandemic. It has an easy-to-use video communication product with good overall quality. Its revenues has been growing strongly, even after the peak of…
-

If Facebook (Meta) disappeared 3 years from today (in 2025), I will not be surprised
Warren Buffet famously said that “Forecasts may tell you a great deal about the forecaster; they tell you nothing about the future.” So, do not treat this as a forecast. Just treat me as a bad forecaster. But really, I am trying to apply a theory about clockspeed into this specific case. Many years ago…
-
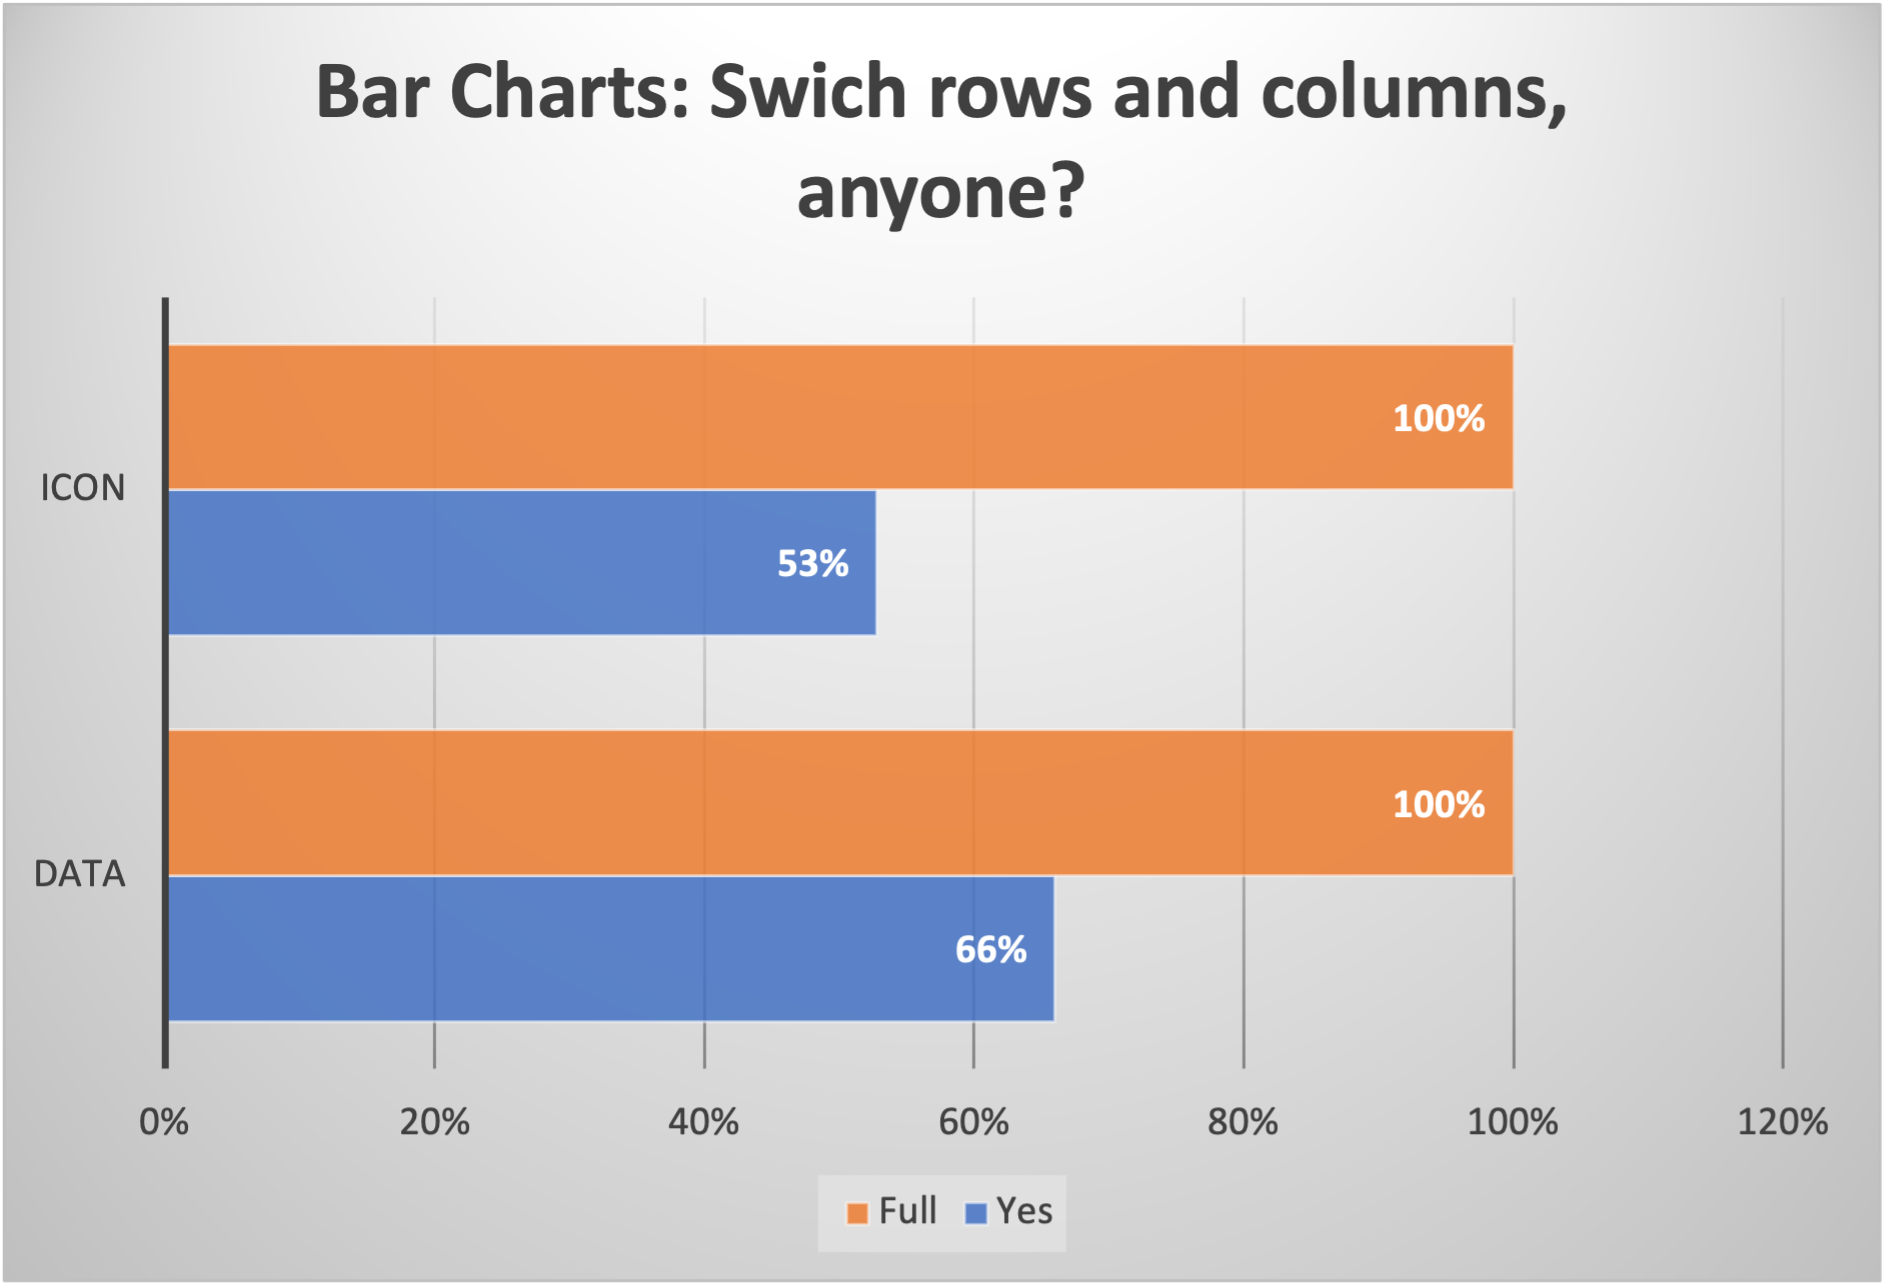
Clustered bar chart and stacked barcharts, switch rows/columns, overlap and customize shapes
Bar charts are one of the most frequently used charts. To use them effectively to generate on-the-point graphs that deliver exactly the right message, however, requires some deeper understanding as well as a few tricks to make them more appealing. I made a quick video that talks about: 1- The basic difference between clustered bar…
-
Are we still ignoring data in making covid-related decisions?
From the early days of Covid, I have been questioning the wisdom of lockdown. In a post I wrote in December 2020, I said the following: “For one, I question the wisdom of economy-wide lockdown. […] the majority of the labor force (people under 45) have a lower mortality risk (less than 5%). Because many…
-

Zillow’s Failure in Housing Flipping is a Classic Example of Ignoring Bottlenecks and Variabilities
By now, we have all heard the story of Zillow losing more than $550 million doing house-flipping. Its CEO blamed it on its forecasting model that produced house-buying prices there were too high, saying that “We’ve determined the unpredictability in forecasting home prices far exceeds what we anticipated and continuing to scale Zillow Offers would…
-

Port of LA: Storage Space is the culprit?
Recently I read about the saga at the Port of LA. According to Ryan Petersen, the chief executive of logistics company Flexport, the real bottleneck at the Port of LA was actually storage space. The article reported: “In a full 3 hour loop through the port complex, passing every single terminal, we saw less than…
-

Why Supply Chain Delays are Multi-faceted: A Mathematical Explanations (Without the Heavy Math)
Paul Krugman recently penned an excellent article explaining why we see the supply chain snarls in New York Times. It mentioned a number of factors: The US consumers are buying a lot more stuff than before, as a partial substitutions to experiences because of the COVID; The processing capacities at docks and hubs have not…
-

Understanding CO2 Emissions for different freight transport modes (renewable as well as non-renewable)
One of the most important questions to ask in transitioning to renewable modes of transport is simply: How much less CO2 are we going to emit by switching to renewables? The other important question is: How much does it cost? I have been researching on that question quite a bit. And I found quite a…
-
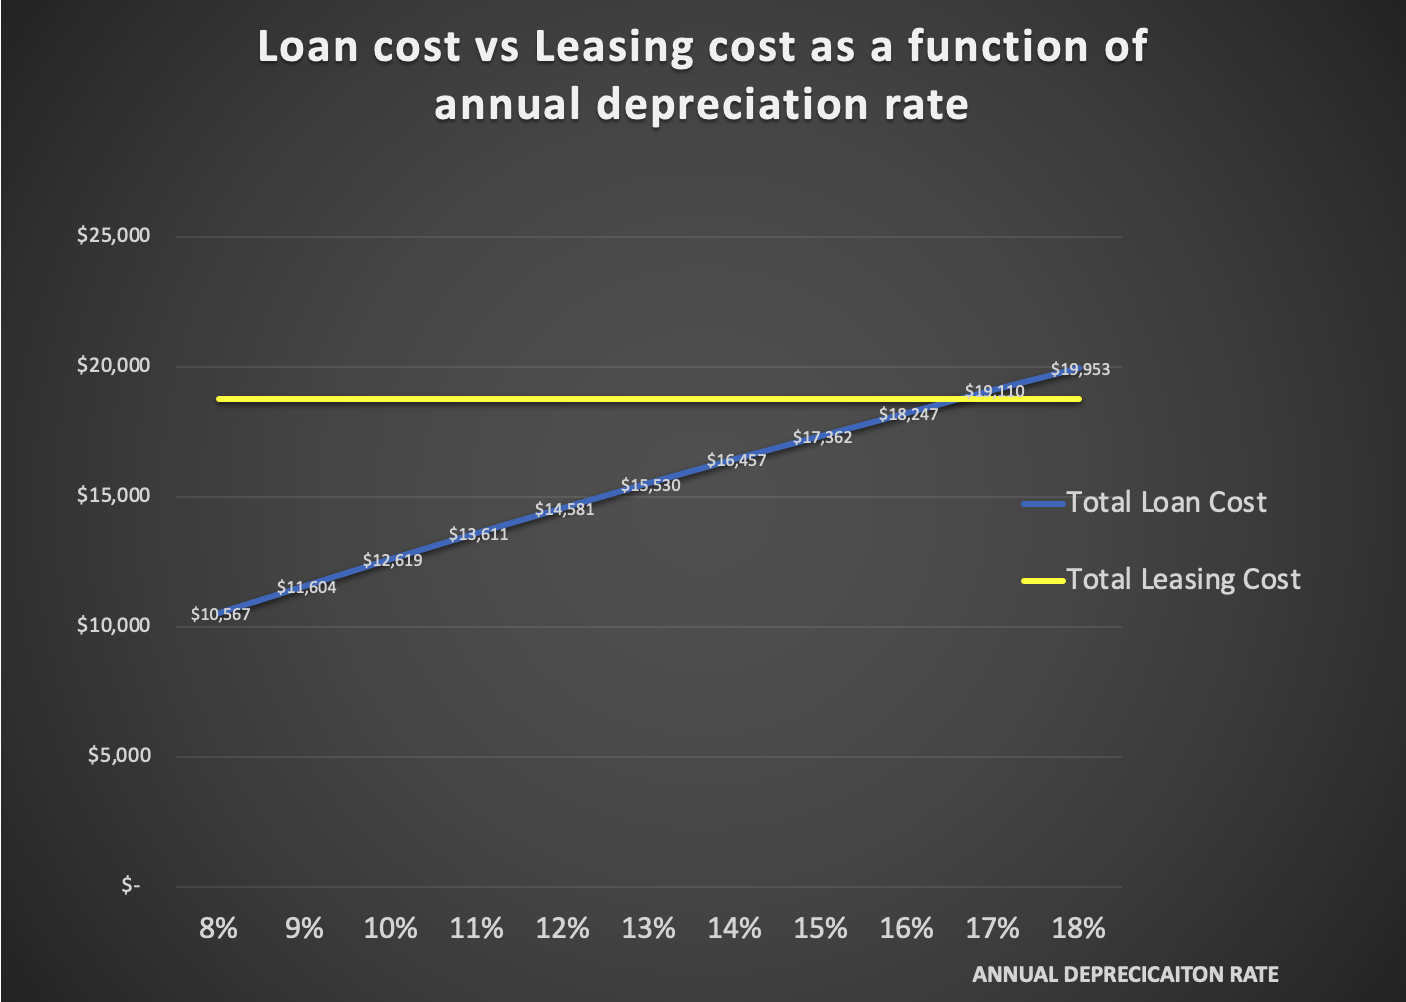
SHOULD I BUY OR LEASE A TESLA? PART 2: Total loan cost (when you are sure about the depreciation)
In a previous post, I calculated the total cost of leasing a Tesla, using my own experience as an example. Before we move on to the buying option, let me mention one important feature of leasing: It has more certainty in terms of total cost. You know what you pay, and you do not worry…
-
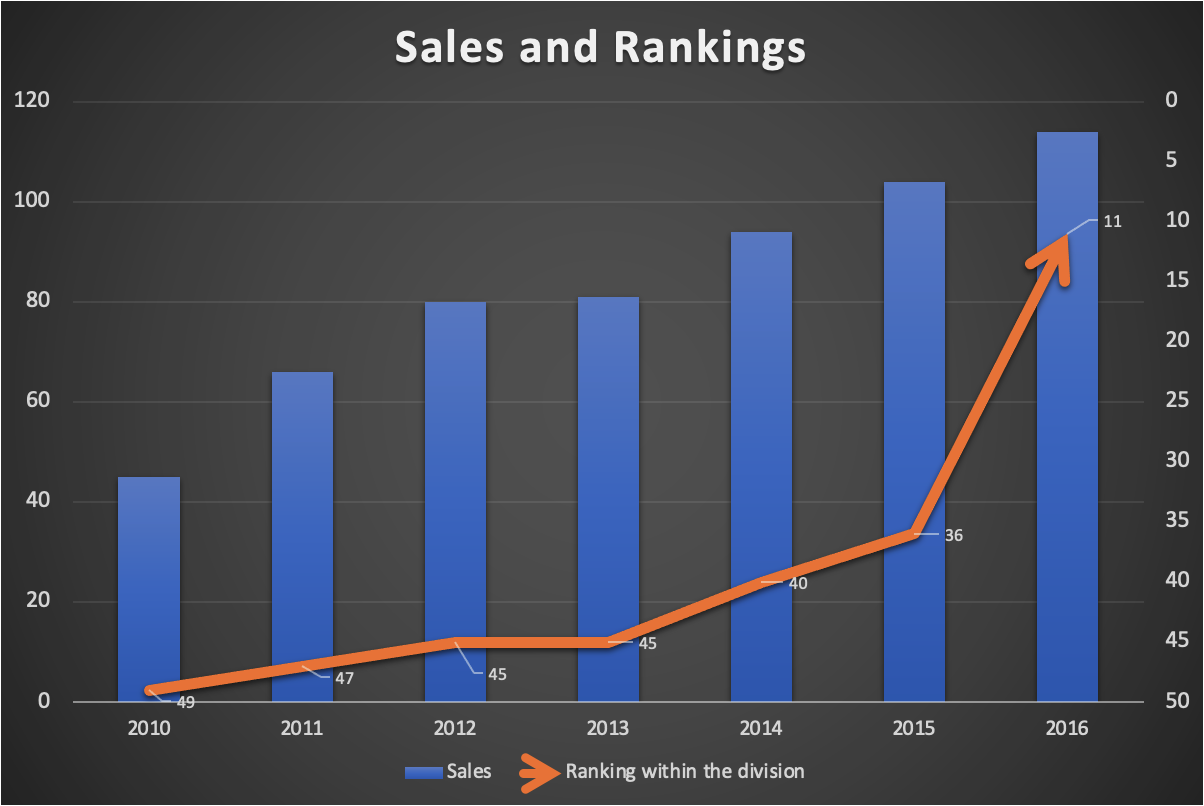
How to draw ranking data properly
A slight problem with drawing data on ranking is how we normally think about ranking. We normally associate “#1” as the best, and “#10” as worse compared to “#1”. But Excel chart typically shows a bigger number in a higher vertical position, and a smaller number in a lower position, as is shown in the…
-
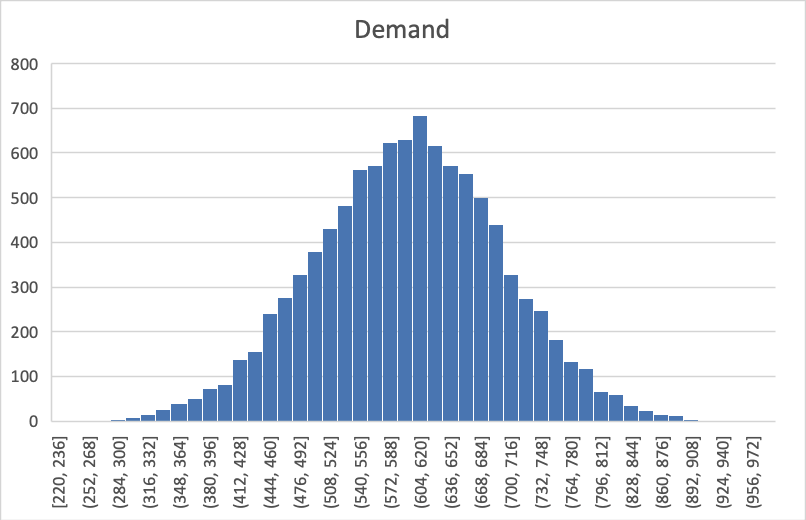
Simulation: Is demand equal to sales? (Part II, and why is there a Loch Ness Monster?)
In an earlier post, we discussed the difference between demand and sales using a simulation exercise. Now the question is: How can we visualize the difference? To start off, we all know the shape of the normal curve (in the example we discussed the mean is 600, and its standard deviation is 100): However, if…
-
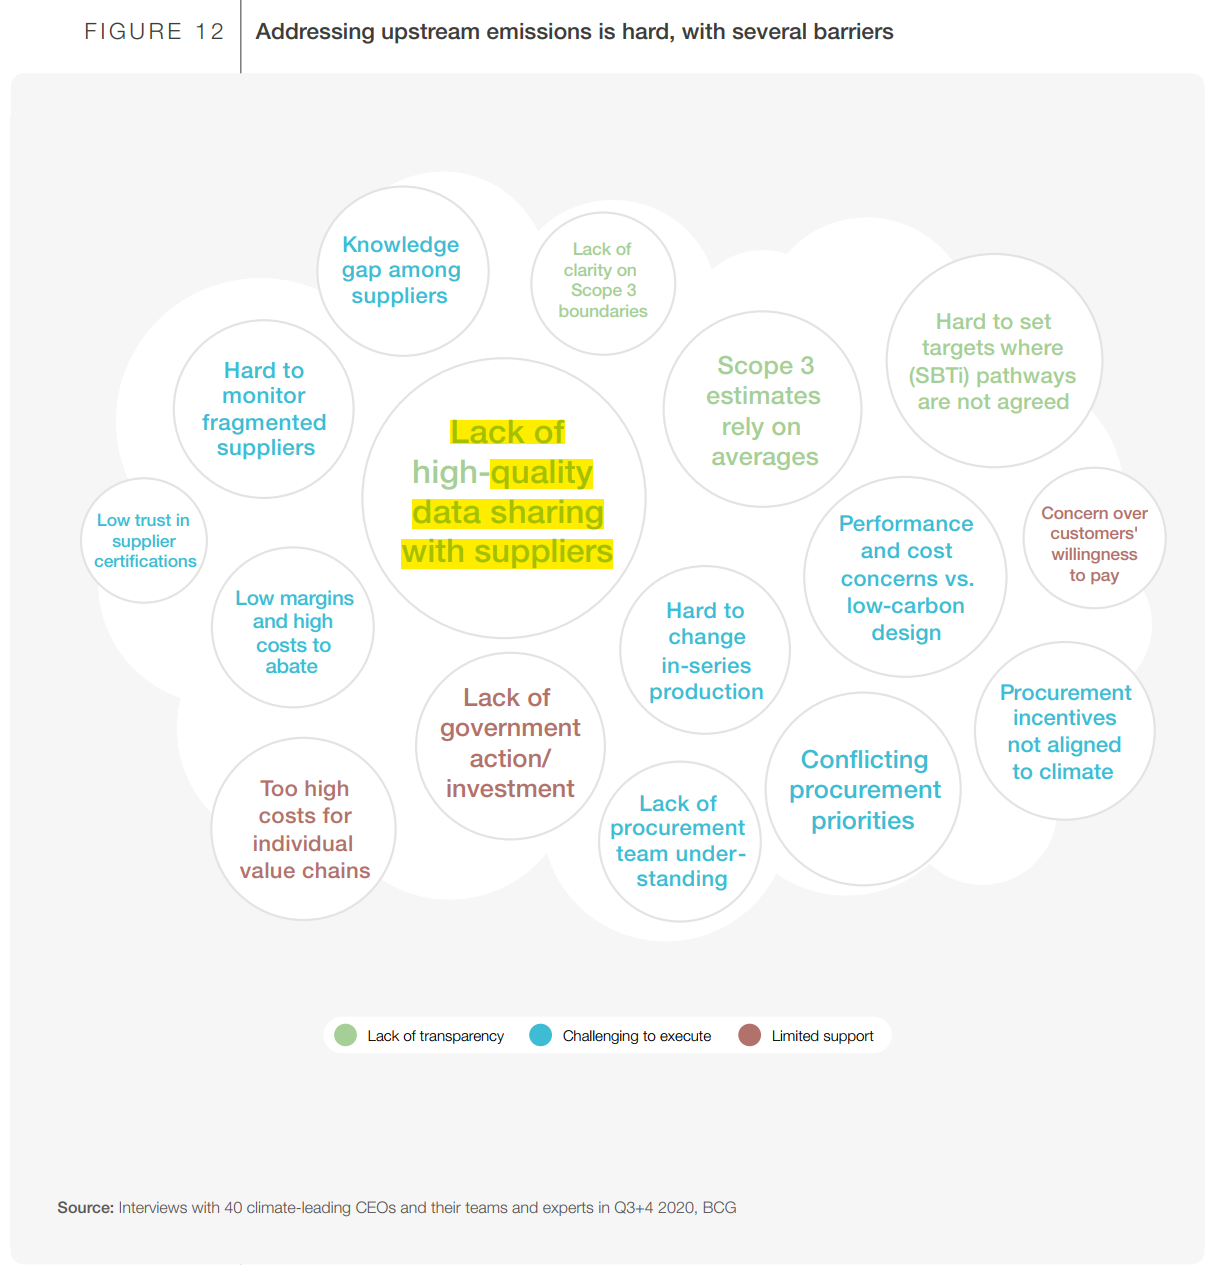
Carbon foot-printing problem is first of all an information problem
Carbon foot-printing problem is, first of all, an information problem. In a recent report released by World Economic Forum, the first challenge in reducing carbon emission is informational: There is just not enough transparency and clarity on who is emitting how much across a supply chain. Because of those informational barriers, companies will benefit from…