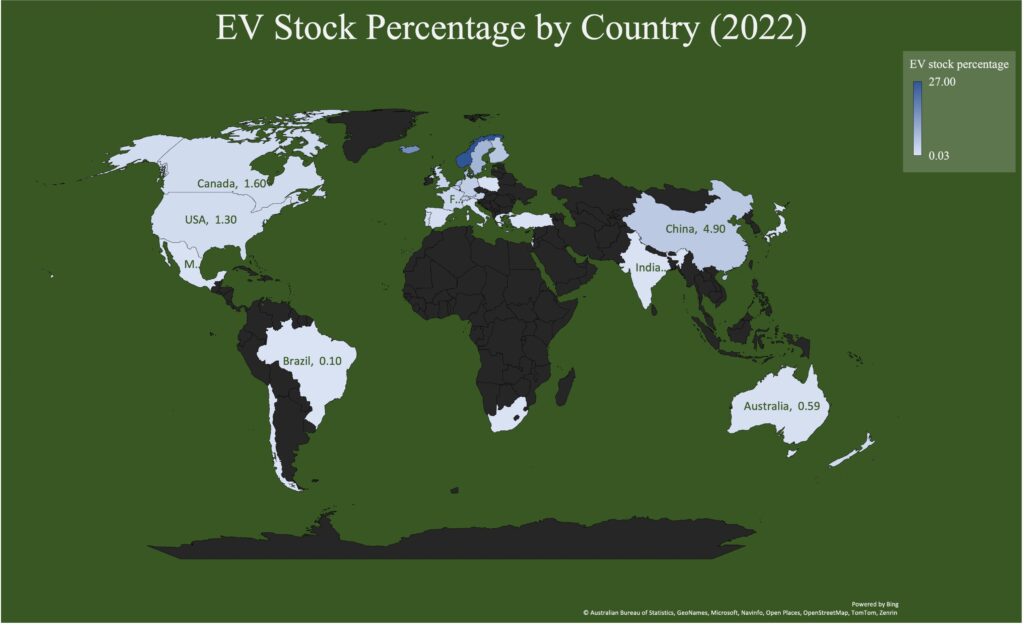
I came across the data of EV stock at the country level from the IEA website. While it is informative, it does not have any map visualization, which is quite easy to do with Excel. So I just did that. The above is the one on EV stock in percentages by country as of 2022.
What can we learn from above?
- There is huge variability among countries, from close to zero to 27% (Norway)!
- Many countries do not reliable data yet. Most likely those countries are close to zero.
- China has increased its EV stock quite a bit.
- Europe, as a whole, is pretty close to the world average. Even though it has some of the highest country adoption rates (e.g. ,Norway), they are small in absolute volume.
- US, on the other hand, as one of the largest EV market, is fall behind.
When plotted over time, we can see the US started falling behind the world average somewhere around 2019.

This is worrisome, because the US is supposed to lead the work in clean energy transition.