Category: data
-

Why Additive Manufacturing (or 3D Printing)?
[Header image credit: Wikipedia] I have been interested in 3D printing (the technical name should be “Additive Manufacturing”) for the last 10 years, but why can it be a real alternative to the traditional manufacturing, at least to some industries? Just from a pure physics perspective, AM can make products that other methods cannot. For…
-

Understanding CO2 Emissions for different freight transport modes (renewable as well as non-renewable)
One of the most important questions to ask in transitioning to renewable modes of transport is simply: How much less CO2 are we going to emit by switching to renewables? The other important question is: How much does it cost? I have been researching on that question quite a bit. And I found quite a…
-

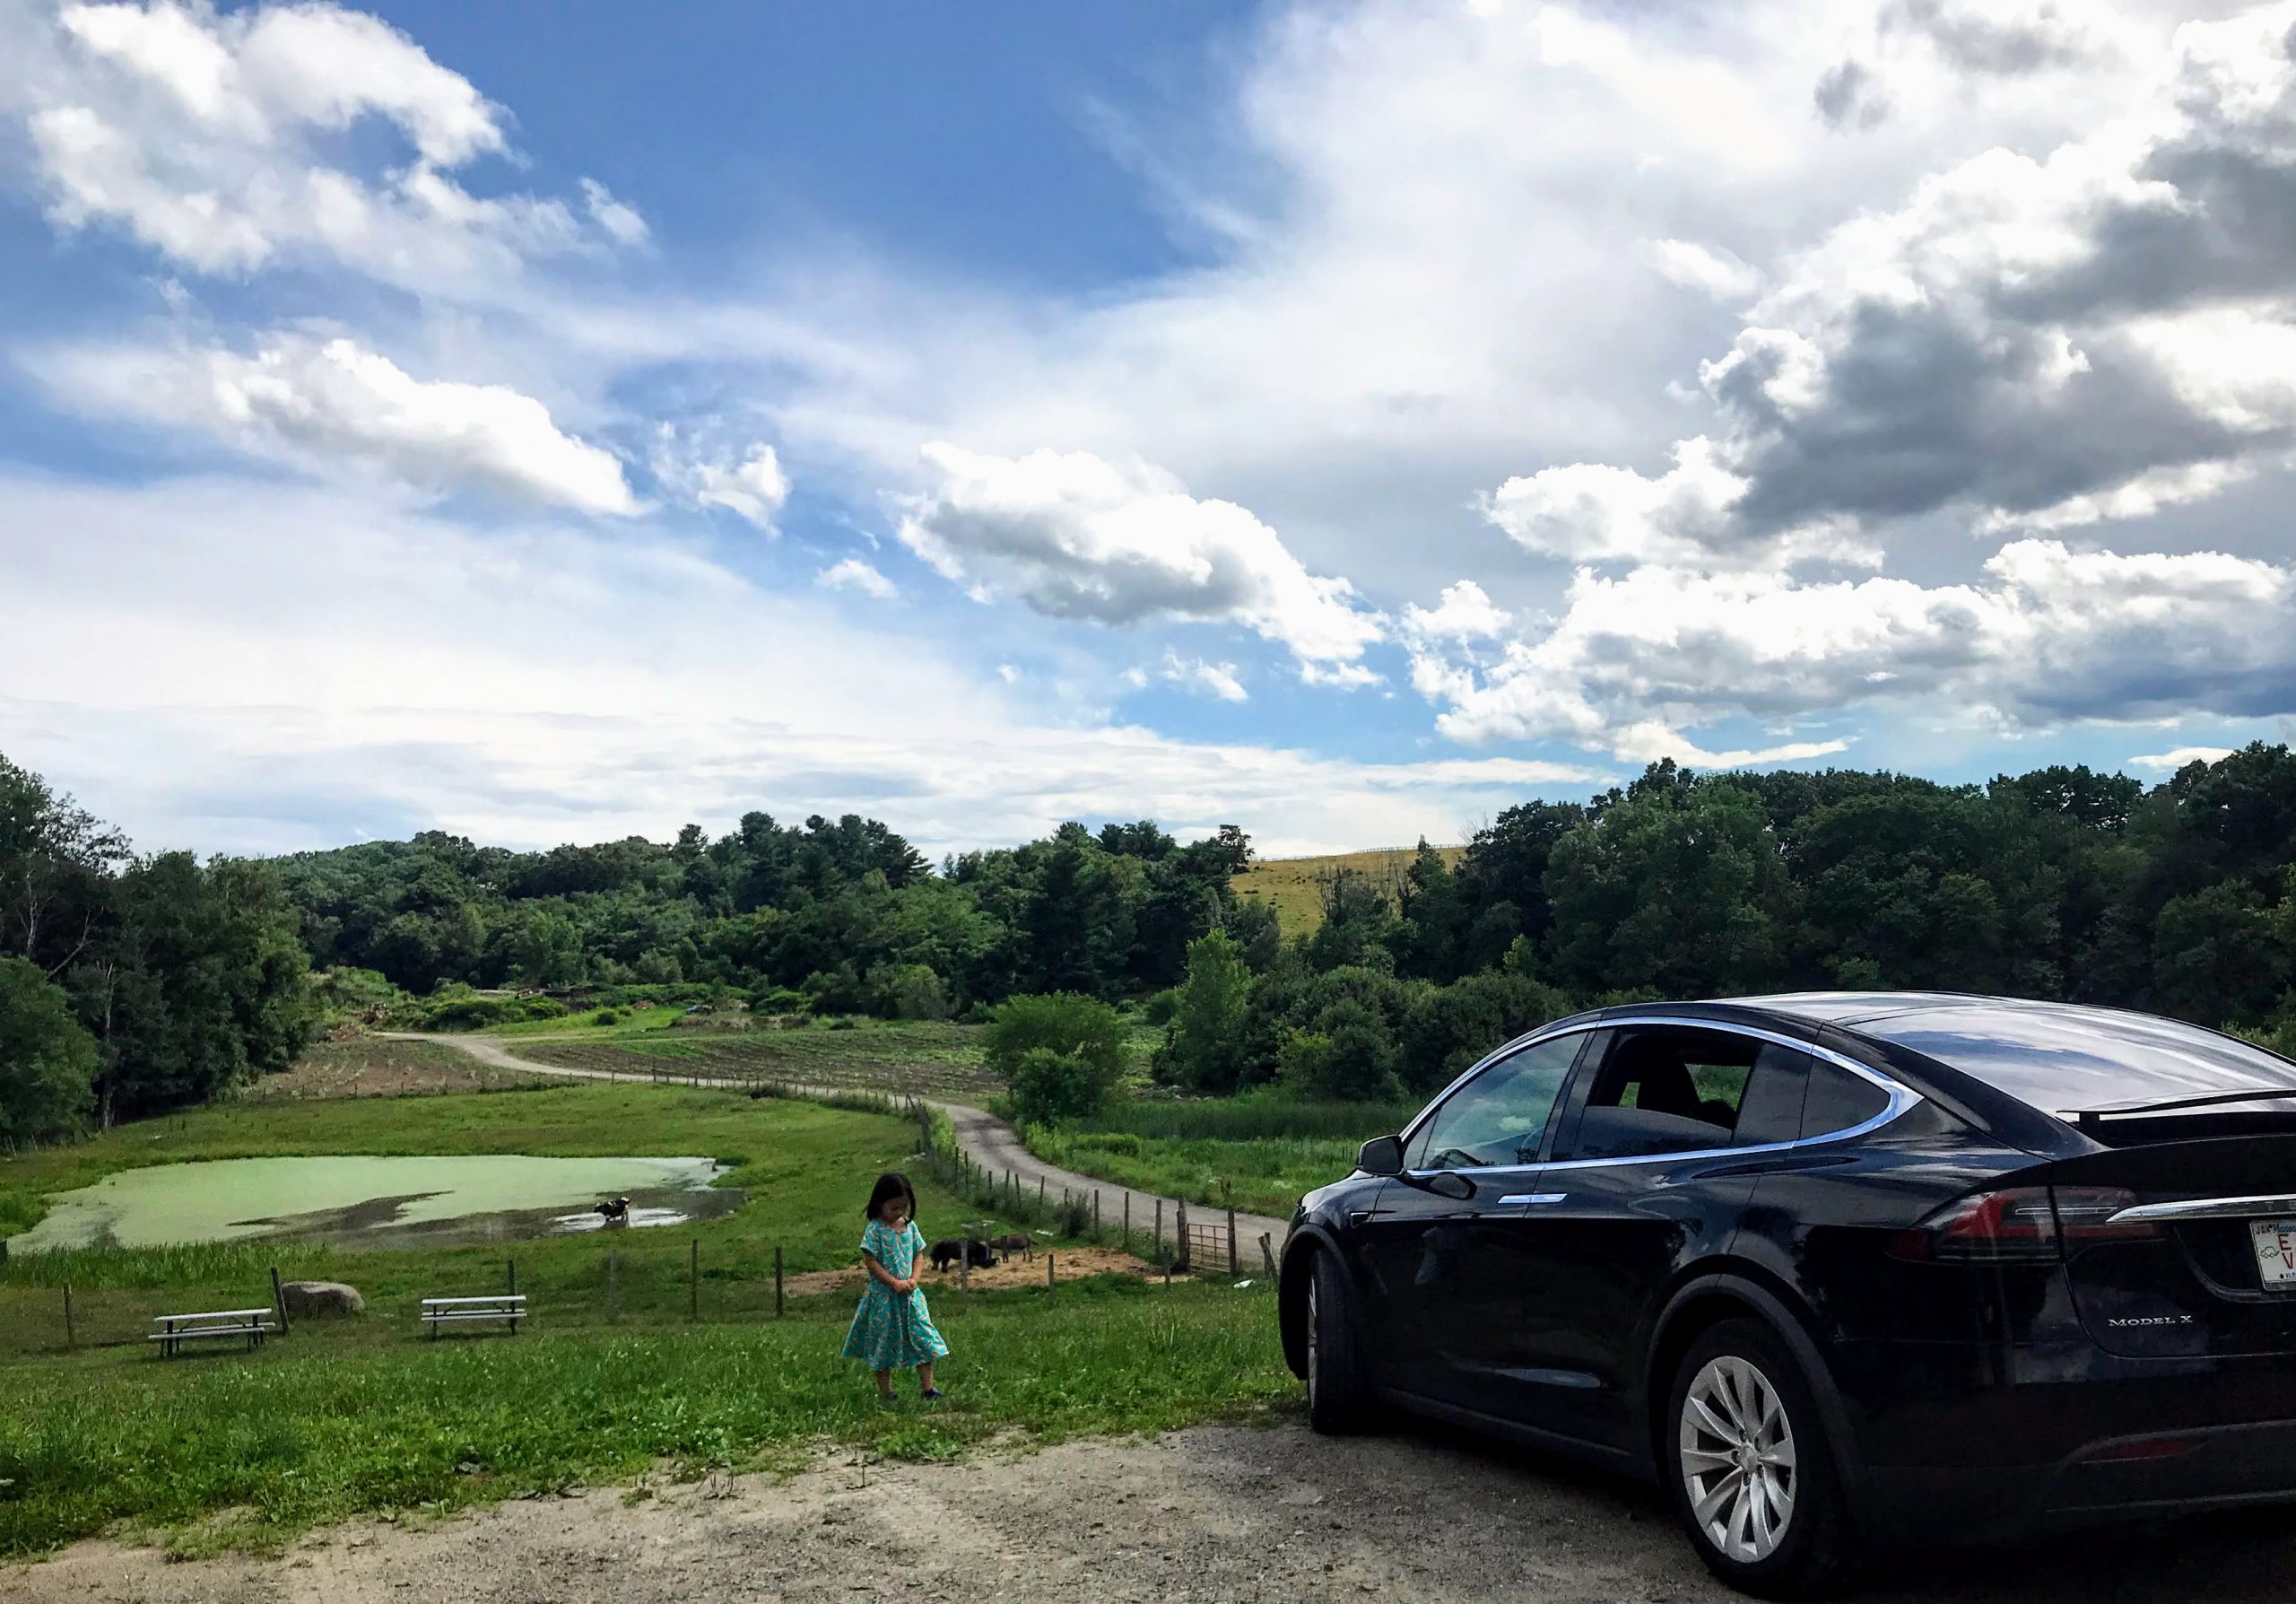
Tesla Lease Mileage Limit and the Central Limit Theorem
I am onto my second Tesla car leases now, so I think I can define another form of range anxiety with my leased cars: Driving over the lease limit. It was actually quite interesting. When I was leasing my first Tesla, I did a rough calculation of my daily driving, and figured that 10,000 miles…
-
SHOULD I BUY OR LEASE A TESLA? PART 3: It is not black-and-white (because we do not know the future)
In my last post, I showed that the total cost of buying a Tesla with a loan (or cash) is easy to figure out. However the final value is critically dependent upon one thing: the depreciation of the car when the owner sells it. Unfortunately that quantity is uncertain, because it has not happened yet…
-
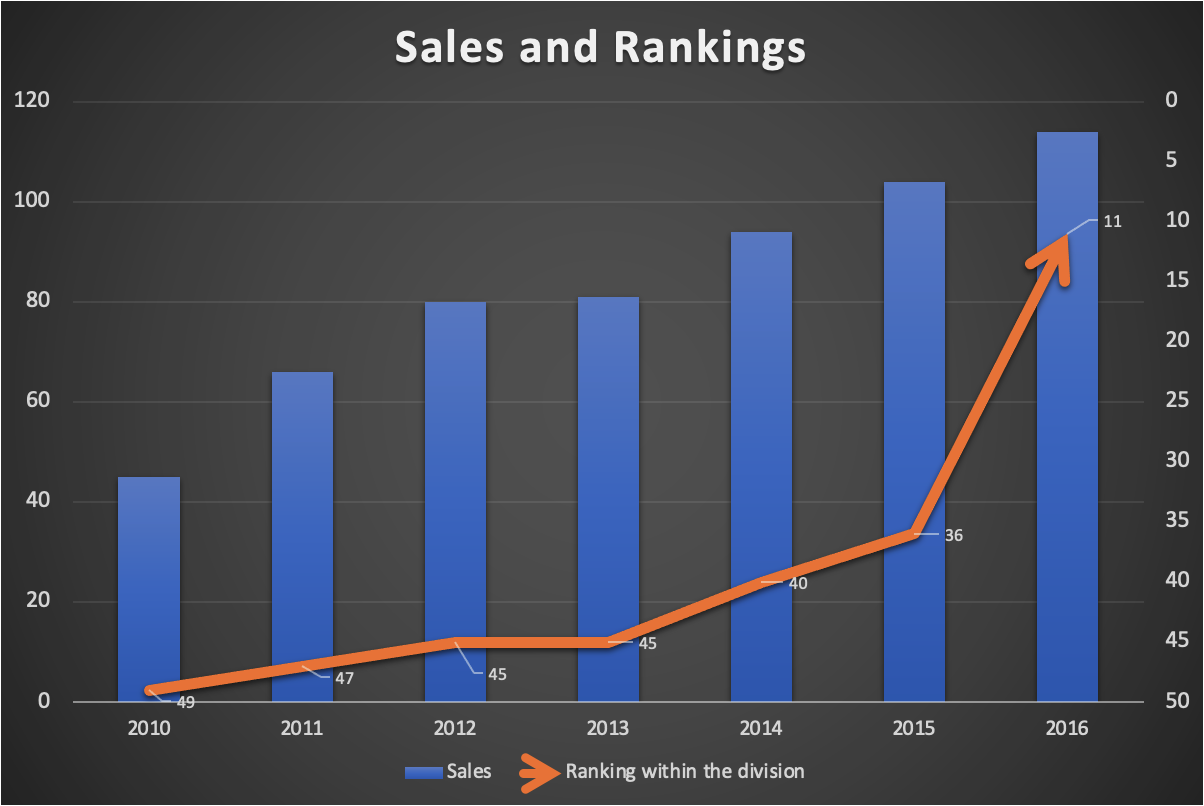
How to draw ranking data properly
A slight problem with drawing data on ranking is how we normally think about ranking. We normally associate “#1” as the best, and “#10” as worse compared to “#1”. But Excel chart typically shows a bigger number in a higher vertical position, and a smaller number in a lower position, as is shown in the…
-
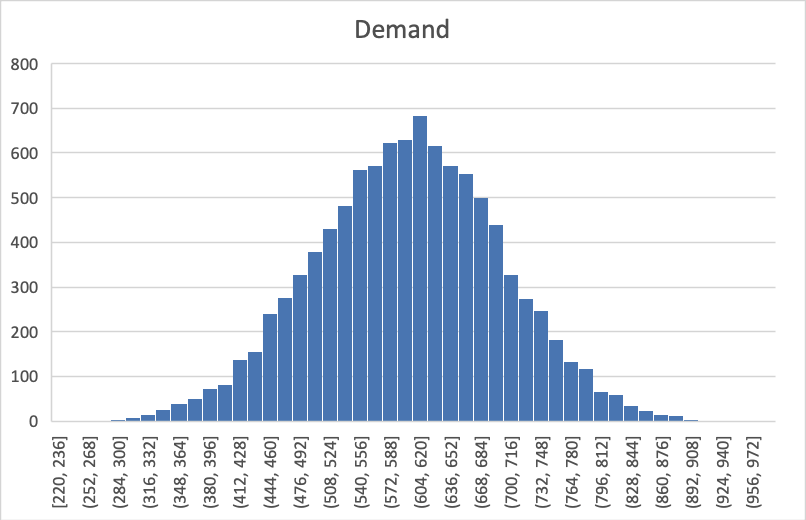
Simulation: Is demand equal to sales? (Part II, and why is there a Loch Ness Monster?)
In an earlier post, we discussed the difference between demand and sales using a simulation exercise. Now the question is: How can we visualize the difference? To start off, we all know the shape of the normal curve (in the example we discussed the mean is 600, and its standard deviation is 100): However, if…
-
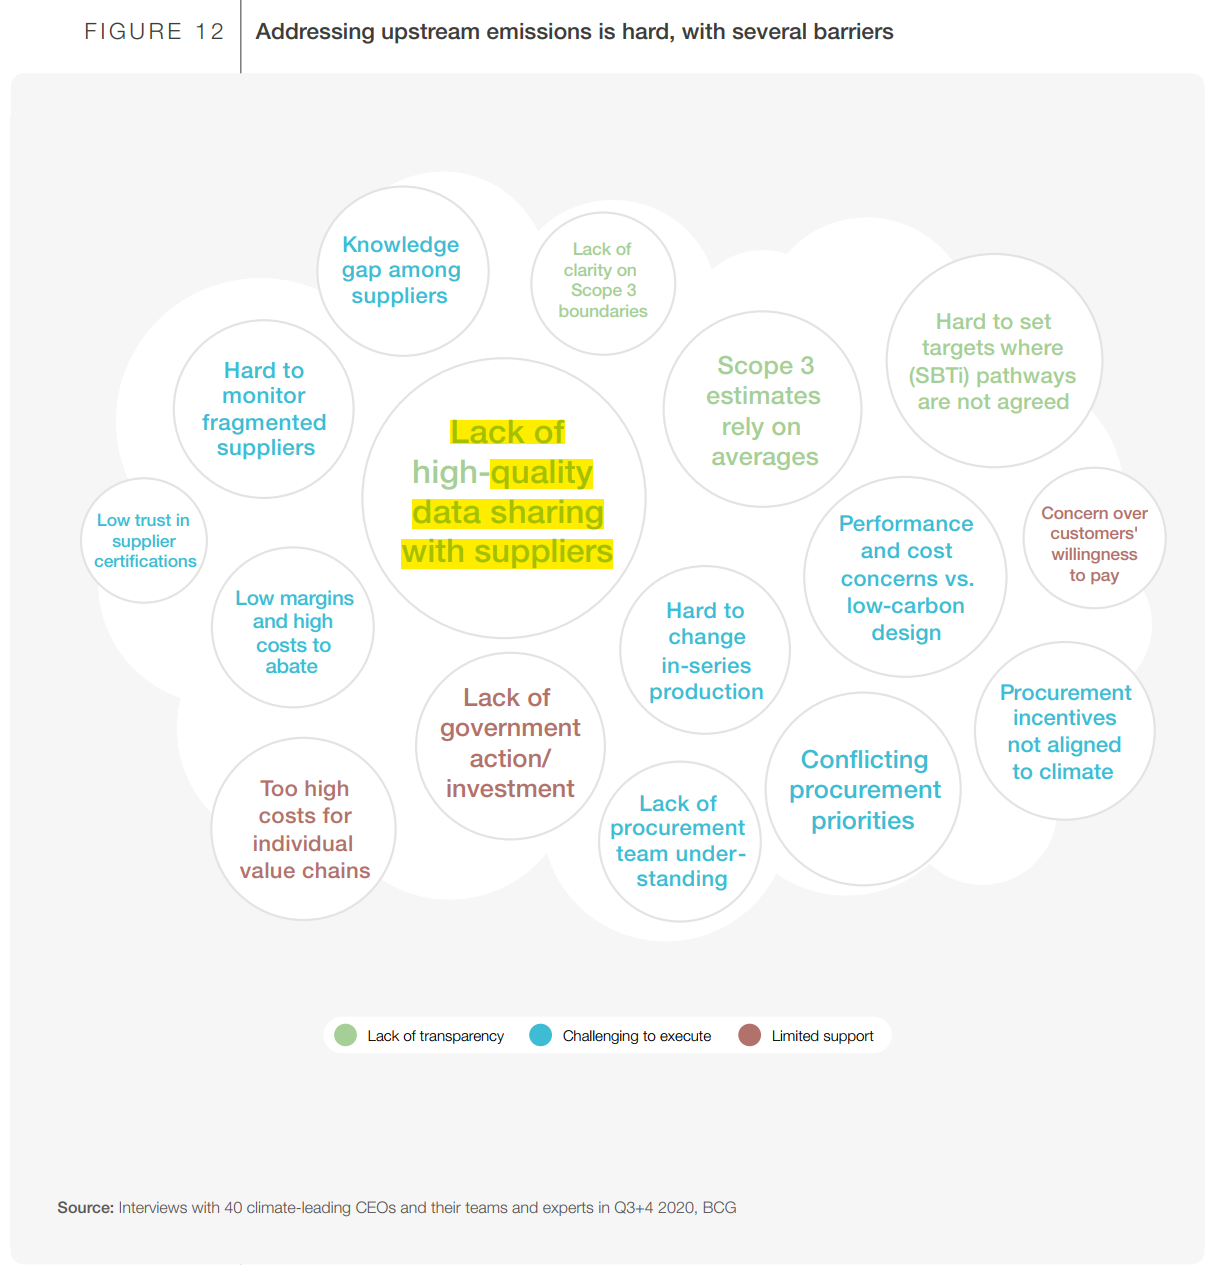
Carbon foot-printing problem is first of all an information problem
Carbon foot-printing problem is, first of all, an information problem. In a recent report released by World Economic Forum, the first challenge in reducing carbon emission is informational: There is just not enough transparency and clarity on who is emitting how much across a supply chain. Because of those informational barriers, companies will benefit from…
-
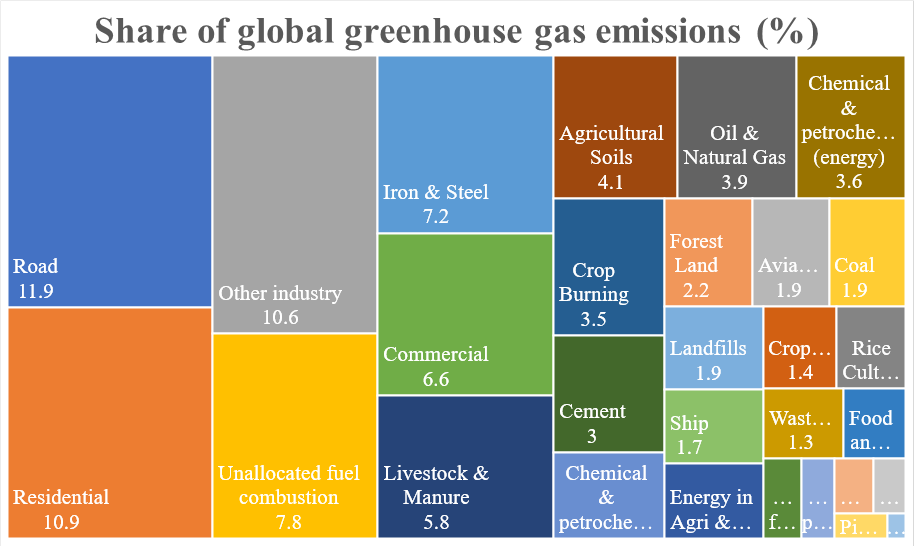
Road Transportation is the Single Largest Decarbonization Opportunity with a Clear Path Forward
My apology for the unwieldy title. But I chose the long title to highlight one thing: Although there are many decarbonization opportunities with large impact, road transportation offers the clearest path forward. Let me elaborate. First, let’s examine the areas where we need to reduce our carbon footprints. There are lots of high-quality research and…
-
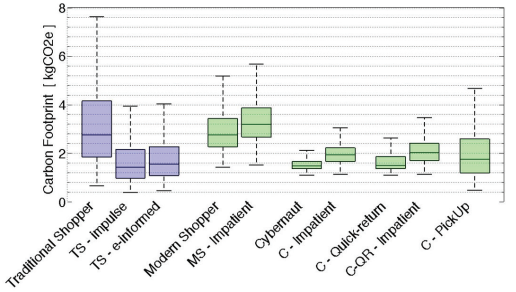
Carbon Foot printing: Devil is in its details…
I have been reading up on the carbon foot printing work lately. A lot of interesting findings. Overall, my impression is that the modern e-commerce is not significantly improving our carbon footprint. And with customers’ adaptive behavior (e.g., ordering more, not giving up store trips), it is likely that we can end up with a…
-
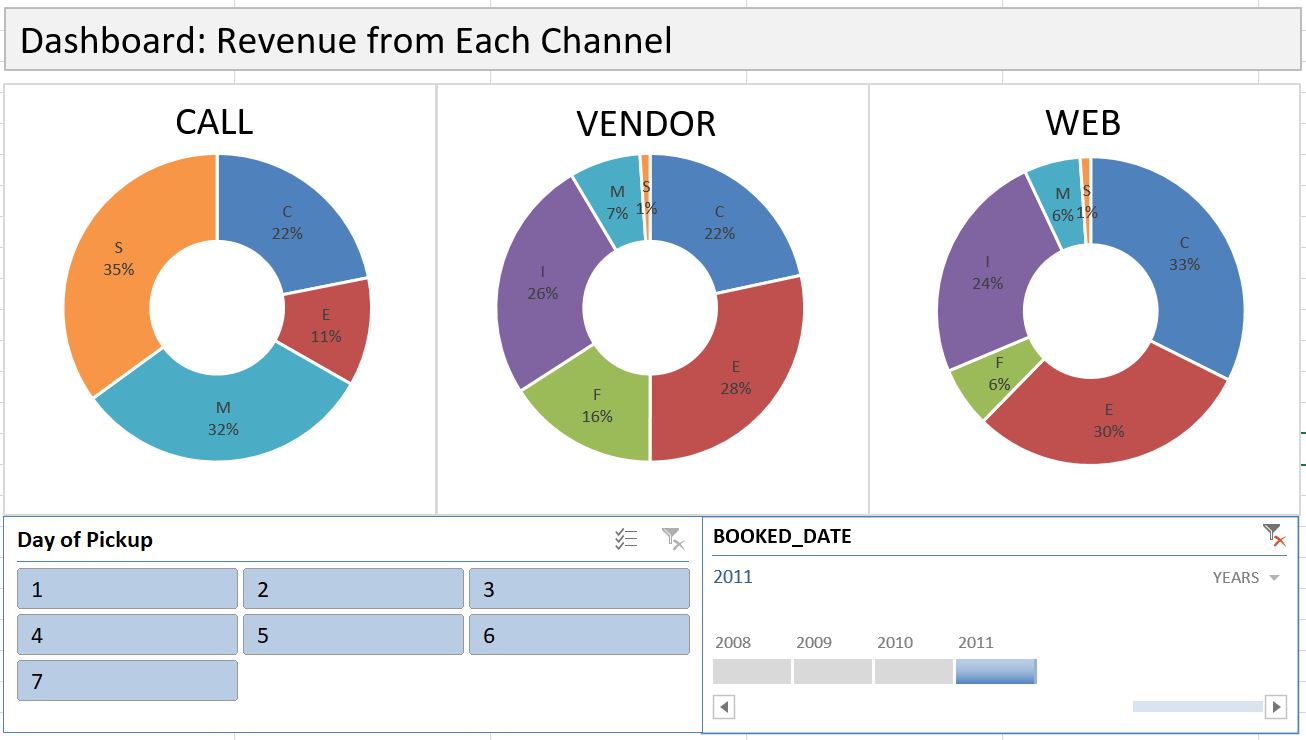
Excel Pivot Table Trick: Drawing Charts Using Only Part of the Pivot Table
As I showed in a previous post about dash-boarding with Pivot Table, generating multiple charts with a Pivot Table can be very useful. But the problem is that Excel will automatically take the entire Pivot Table and generate a chart. You cannot even delete any data points from that chart(!), because they are part of…
-
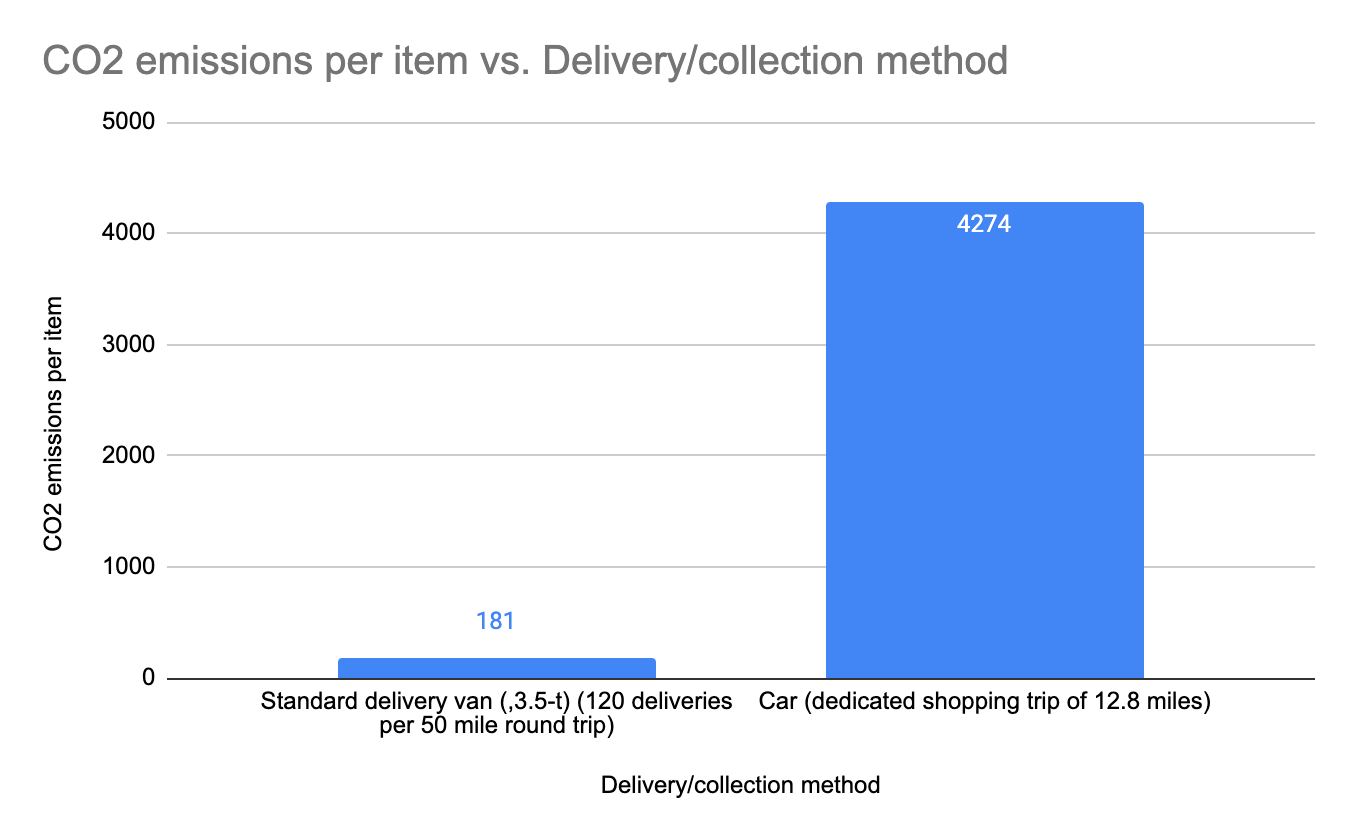
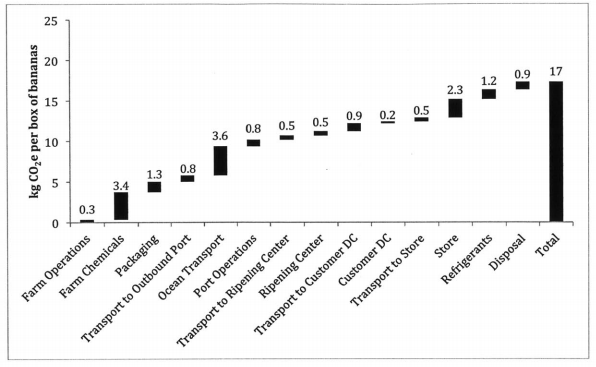
The Carbon-reducing Effect of E-commerce Delivery
In an early article I discussed the perils of higher carbon print in online grocery shopping (mainly from a paper by Van Loon et al (2015). However, let’s not forget that the paper did find that when it comes to delivery using dedicated vans carrying a large basket size (as opposed to just a few…
-
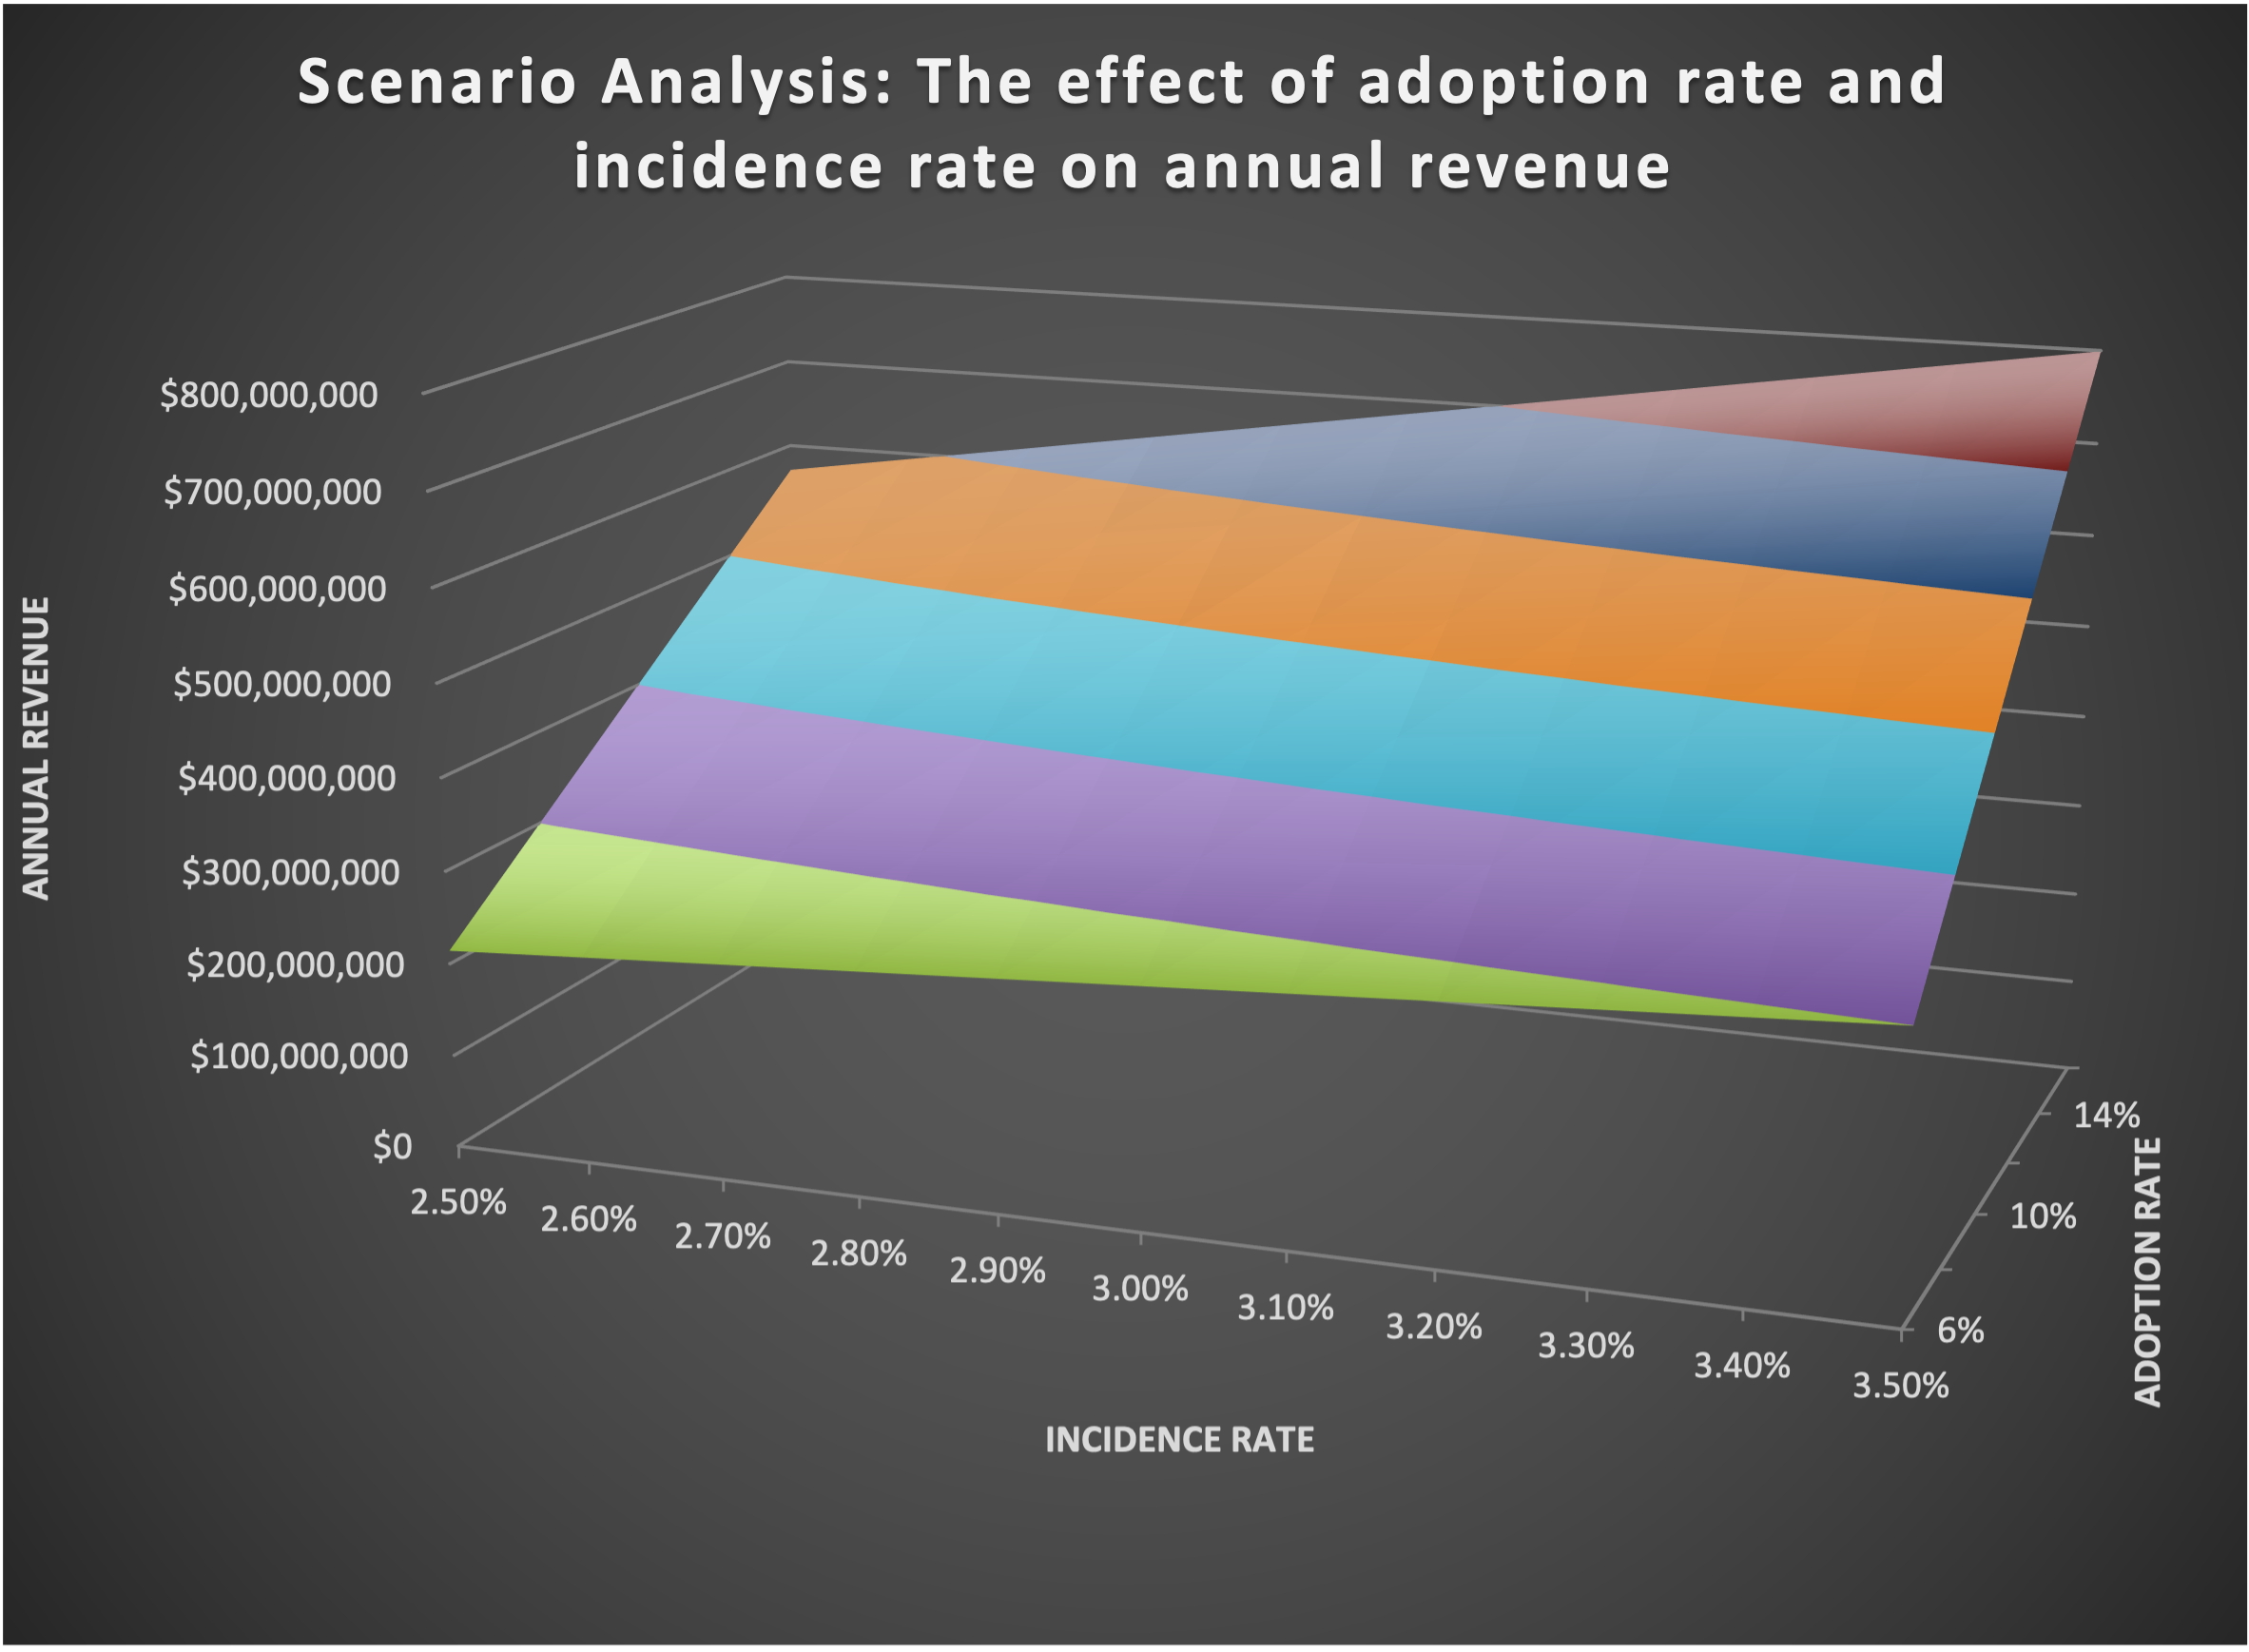
Two-way Data Table in Excel is a great tool for sensitivity analysis
In an earlier post, I have introduced Data Table as a “secret weapon” to conduct sensitivity analysis. Now let’s go one step further and look at a more advanced type of Data Table called Two-way Data Table. As the name suggests, it offers a way to study the joint effect of TWO variable on the…
-
Measuring the Carbon Footprint of a Supply Chain: 3 Scopes
The Greenhouse Gas Protocol has established a set of standards to measure and manage GHG emissions. To me it seems to be the dominant framework in measuring the carbon footprint of an organization and/or a supply chain. The key to understanding the GHG protocal is that it includes three scopes: Scope 1: Any emission that…
-

Zero-Carbon Economy: A Grand -and Necessary – Vision
I just watched a video produced by Cambridge University called “The Climate Crisis: Towards Zero Carbon”: Well done, Cambridge! The video first shows that data on historical CO2 levels and temperature makes it irrefutable that the current climate crisis is created by us humans. The video then highlights a few important areas for decarbonization: Energy…
-
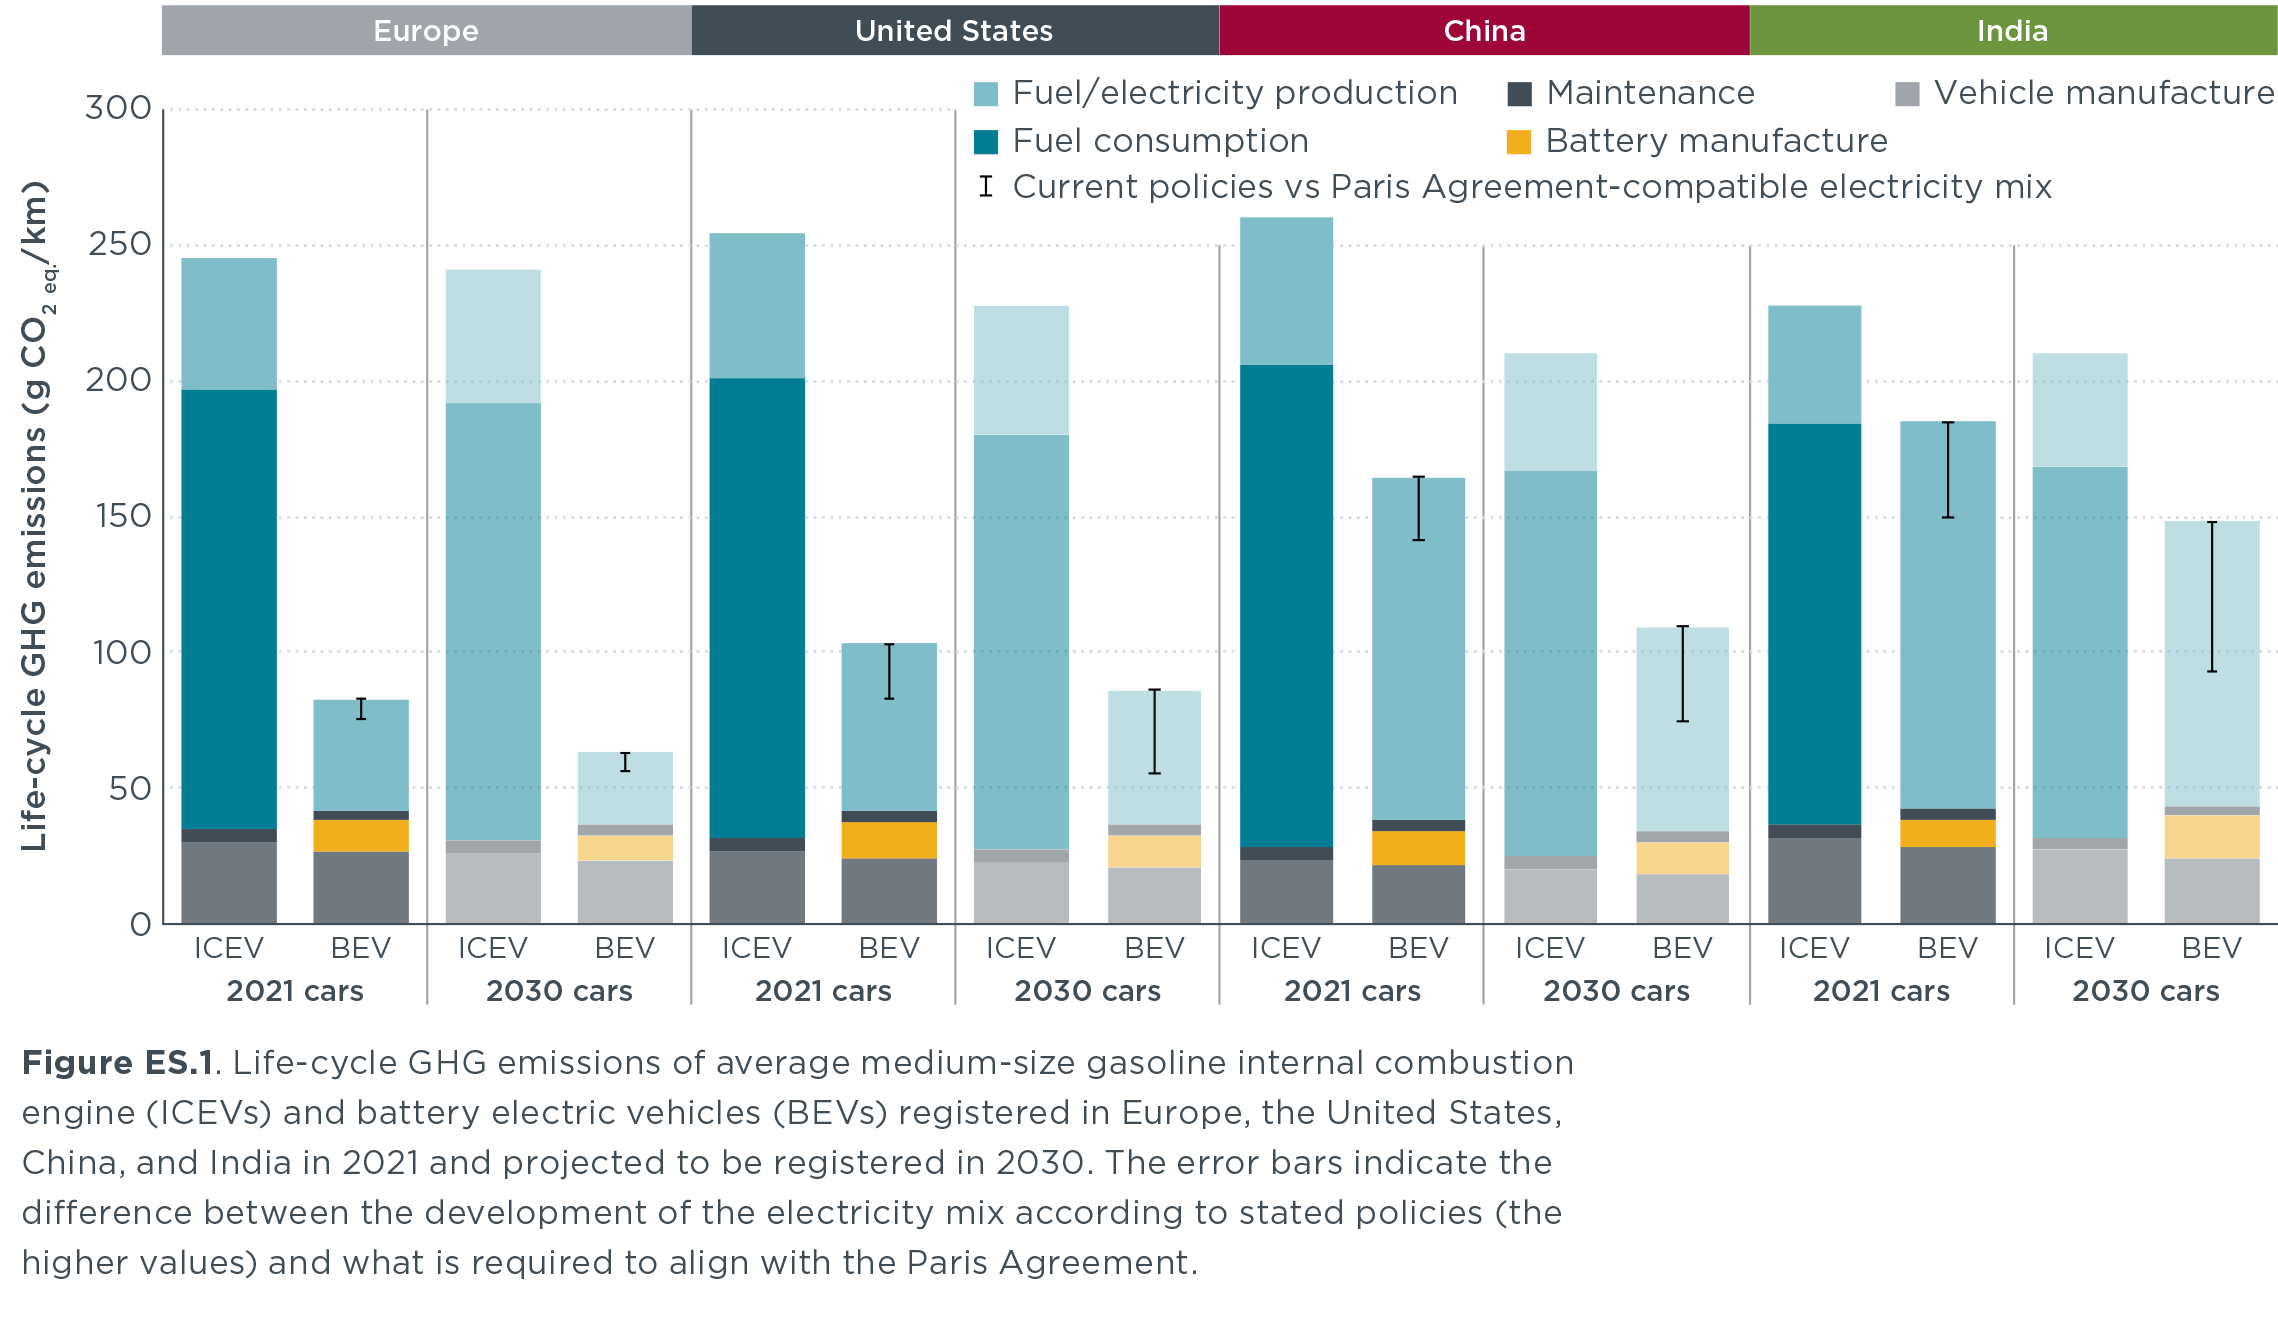
ICCT’s Report on the Lifecycle Comparisons of GHG Emissions of Gas Cars vs. EV is Filling a Void
Today The International Council on Clean Transportation release a report called “A global comparison of the life-cycle greenhouse gas emissions of combustion engine and electric passenger cars“, which I find a satisfying read. Its key findings can be highlighted in the following graph: The graph is quite dense, so let me point out a few…
-

The Most Factual and Poignant Article on the Failure on COVID Data Collection and Interpretation (So Far)
Today, WSJ published a scathing opinion piece by Dr. Marty Makary from Johns Hopkins University titled “The Flimsy Evidence Behind the CDC’s Push to Vaccinate Children: The agency overcounts Covid hospitalizations and deaths and won’t consider if one shot is sufficient.” This is by far the most compelling article I have ever read so far…
-
Modeling Driving Distances (3)
Since my last post on using NTHS dataset to fit people’s driving distances, I have made some further modifications: (1) There are some very large TRPMILE data values, in the order of 1000 miles. While there are most likely valid data – After all, people do travel that far – I realize that this is…
-
Modeling Driving Distances (2)
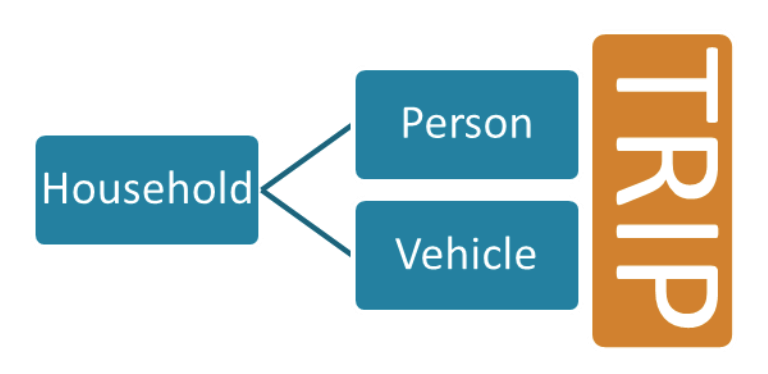
The National Household Travel Survey (NHTS) is probably the most comprehensive data source on driving behaviors of people in the US. It captures travel by US residents in all 50 States and the District of Columbia that includes trips made by “all modes of travel (private vehicle, public transportation, pedestrian and cycling) and for all…
-
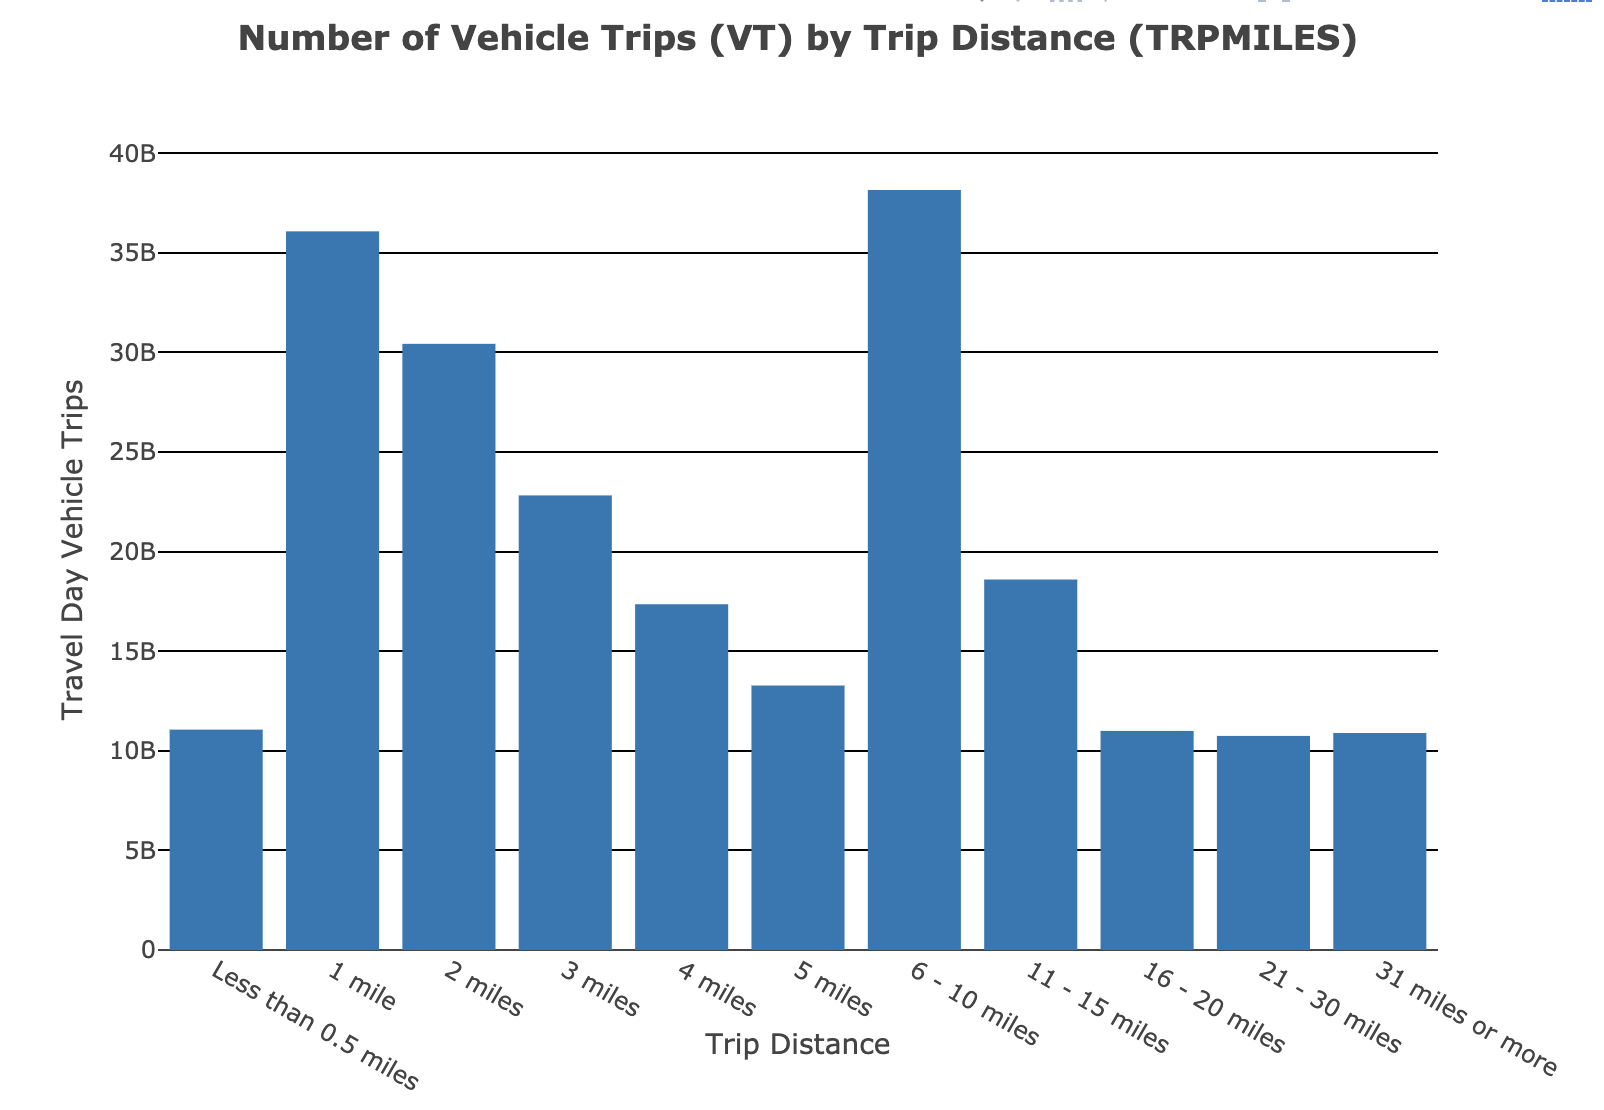
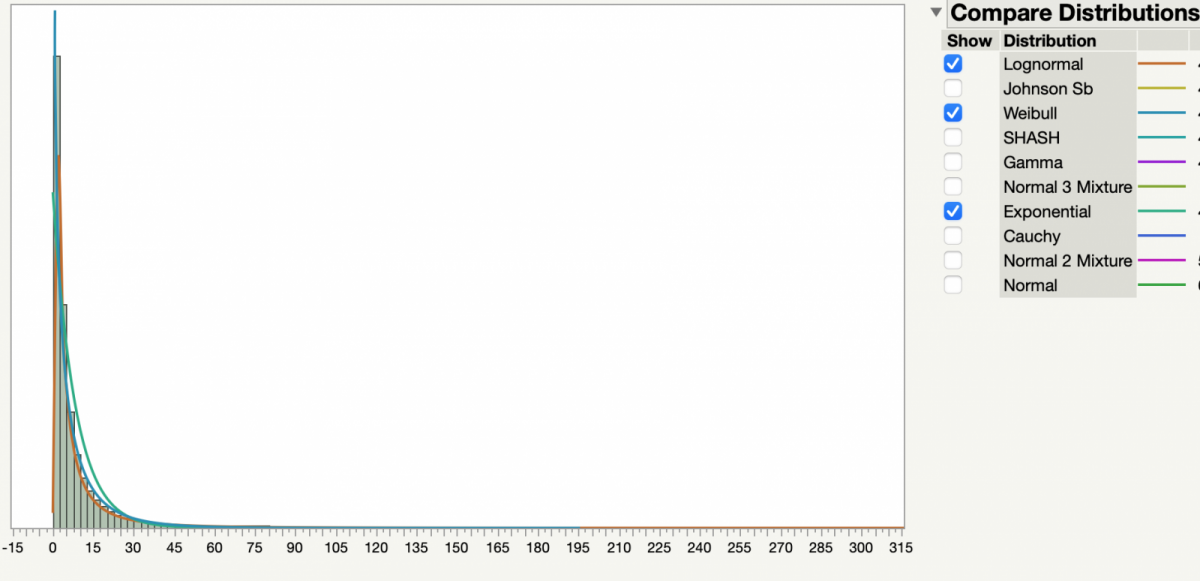
Modeling Driving Distances (1)
In order to qualitatively study range anxiety, one of the first steps is to understand people’s driving behavior. A basic question is: What is the statistical distribution of trip lengths of a typical consumer? I found the answer on National Household Travel Survey’s website: https://nhts.ornl.gov/. The variable I am interested in is called “Vehicle trips”,…
-
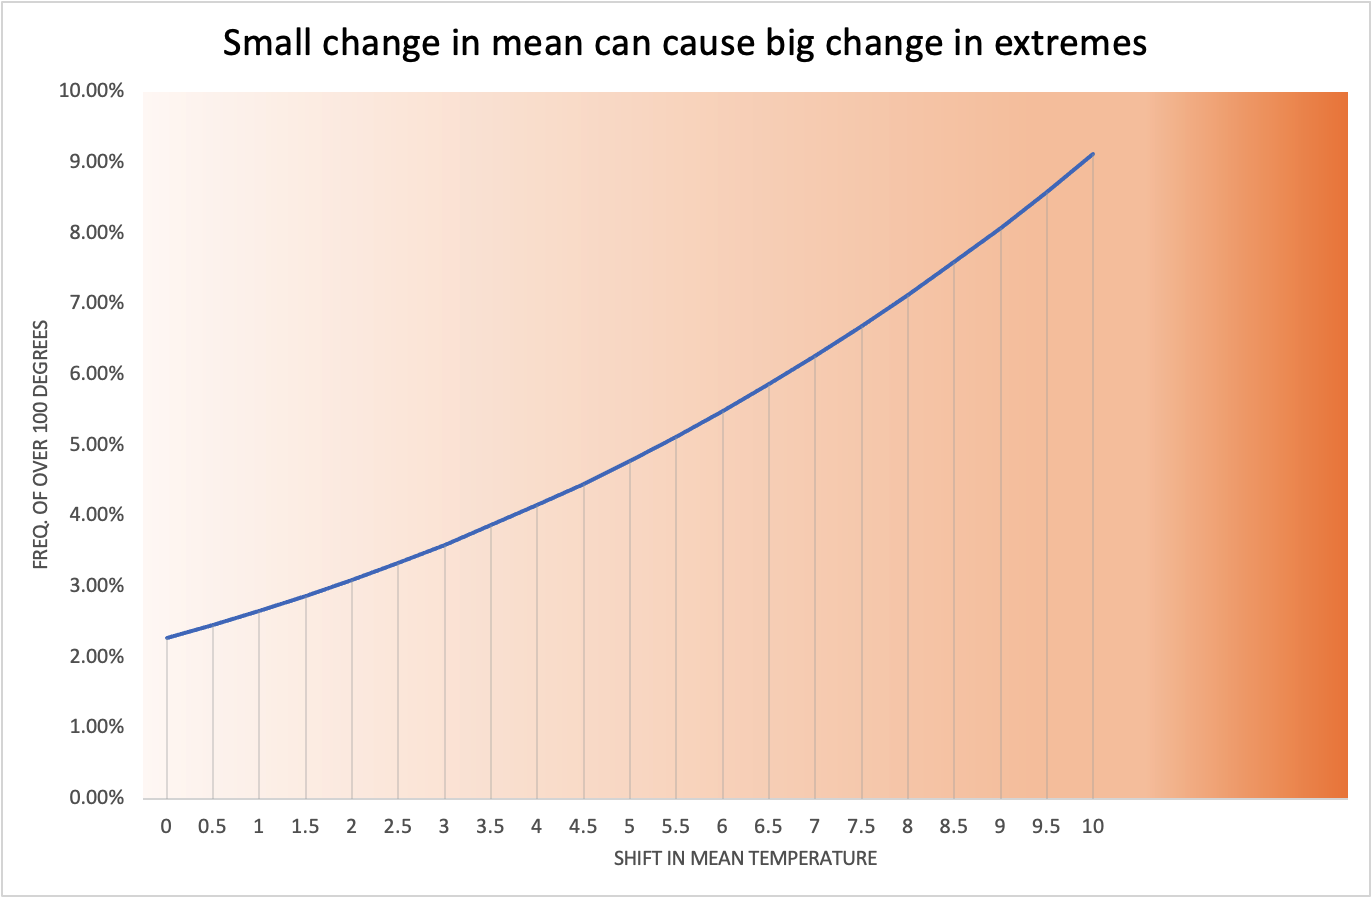
Small change in mean can result in big change in extremes
We have witnessed the recent extreme heat in the US Pacific Northwest. The city of Seattle (one of my favorite cities!) set a new record for the highest temperature ever recorded: 108 degrees. Incidentally the previous record high of 105 degrees was only 11 years ago in 2009. Why do we see extreme weathers more often? I think…