The National Household Travel Survey (NHTS) is probably the most comprehensive data source on driving behaviors of people in the US. It captures travel by US residents in all 50 States and the District of Columbia that includes trips made by “all modes of travel (private vehicle, public transportation, pedestrian and cycling) and for all purposes (travel to work, school, recreation, and personal/family trips).”
I am very excited when I see that NHTS has raw data posted on their website! More excitingly, I was able to import the data into Excel!
A word about the basic structure of this database. If you read its user guide (I have learned it is always a good idea to read the user guide first!), you will see the hierarchy of different data tables:
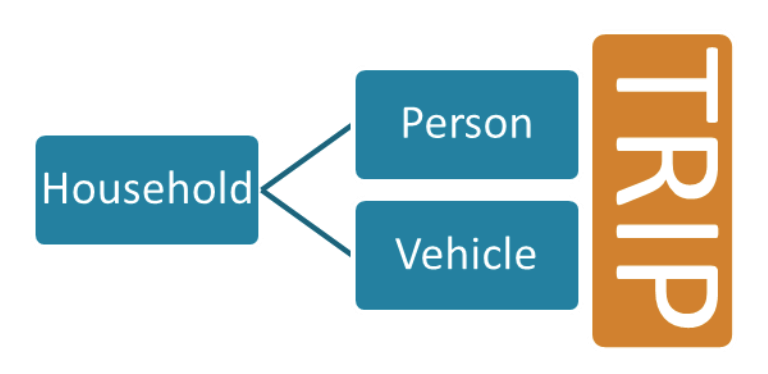
This tells us that trip data is the primary data source. It happens to be what I need in look at the statistical distribution of trips. So I went ahead and downloaded it to Excel.
The key variable I am looking at is TRPMILES. Its official definition as well as other basic info are as follows (copied from the 2017 NHTS codebook)
Name: TRPMILES
Description: Trip distance in miles, derived from route geometry returned by Google Maps API, or from reported loop-trip distance
Question number: ORNL
Type: Numeric
Length: 8 bytes (double precision)
Response frequencies for variable TRPMILES in the Day Trip file
| Unweighted Frequency | Unweighted Percent | |
| Not ascertained | 656 | 0.1 |
| 0-9621.053 | 922,916 | 99.9 |
| Total | 923,572 | 100.0 |
As usual, I looked at the raw data values, and noticed that there are quite some trip miles that have -9 or 0 values. I excluded them. The original file has 923572 records. After cleaning, there are 922431 records. With this many records (approaching Excel’s 1-million-row limit), there are some significant processing lag time on my machine (I use a 2013 Mac Pro with 64GB memory and 3.7Ghz Quad-core Intel Xeon E5). So if you are use a laptop or less powerful machine, be patient. It will take a while.
Then it was just to generate its histogram. I first used PivotTable approach, because I would like to see the numbers so that I can verify the fact that most trips are 10 miles or less. Indeed, here are my Excel PivotTable (the table is long, so I am just showing trips up to 250 miles):
| TRIP MILES | % |
| 0-10 | 78.02% |
| 10-20 | 12.30% |
| 20-30 | 4.20% |
| 30-40 | 1.79% |
| 40-50 | 0.93% |
If you add them up, an astounding 97.2% of all trips are less than 50 miles. 90% of all trips are less than 20 miles. This is a classic long tail distribution!