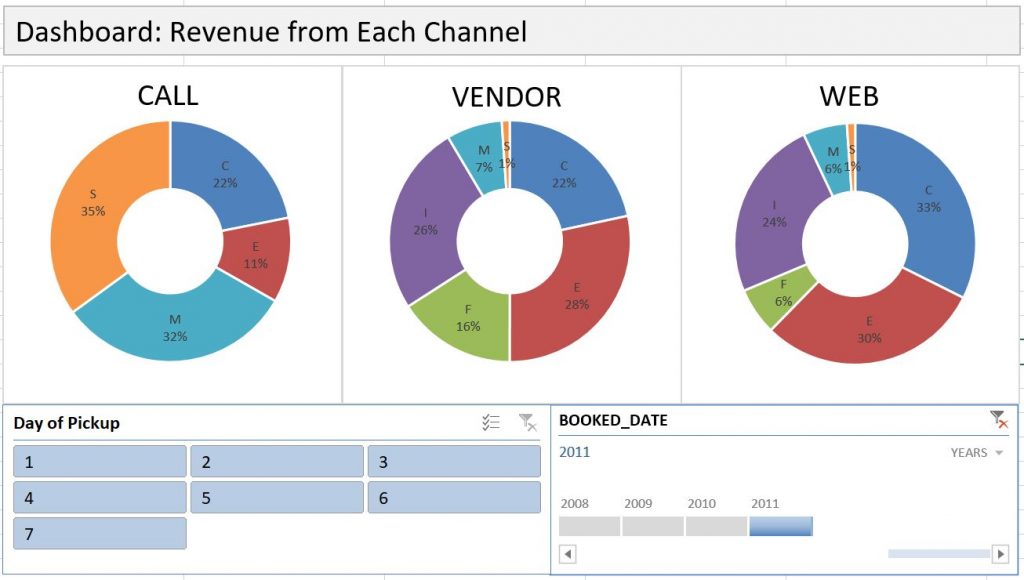
As I showed in a previous post about dash-boarding with Pivot Table, generating multiple charts with a Pivot Table can be very useful. But the problem is that Excel will automatically take the entire Pivot Table and generate a chart. You cannot even delete any data points from that chart(!), because they are part of the Pivot Table.
What to do?
Well, there is a simple trick. You insert a blank chart first, and then you add your desired data to the blank chart by going to “Select Data”.
See the video here:
