Skip to content
ExcelProf.com
  • Home
  • Analytics Blog
  • Energy Blog
  • Book
  • Videos
  • Close Search Form
    Open Search Form
Category

biotech

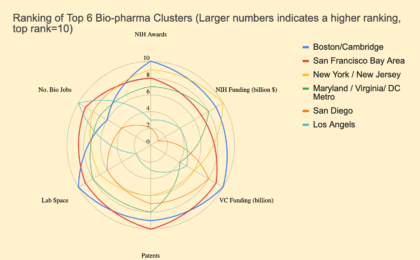
biotech
healthcare
visulization

Top 10 Bio-pharmaceutical Regions in the US by Numbers

The recent COVID-19 pandemic is a testament how incredibly important our biopharmaceutical industry is. It was able to produce vaccines in a record amount of time that saved...

Contact

Email: justinren AT excelprof.com

Recent Posts

  • Tesla’s ticking time bomb?
  • China’s recent covid debacle reveals incompetent and factious management
  • Top 10 Bio-pharmaceutical Regions in the US by Numbers
  • Electric airplane makes sense for one simple reason
  • EV Charging Networks: The Top 8
  • EV prices 2022 (I): The Distribution
  • Choosing the right fuel (III): Whose perspective?
  • Choosing the right fuel (II): Total cost
  • Choosing the right fuel (I): fuel and carbon cost
  • Steps to calculate the carbon footprint of a supply chain
  • EV Fast Charging in the US is becoming better but still has a long way to go
  • The Multiplier Effect of Manufacturing: Where Jobs Come From
  • How large is the supply chain economy? The answer may surprise you
  • So Ford Wants to Do Away with its Dealers…
  • How much do you pay charging an EV on a monthly basis?
  • Excel Trick: Import Data From a Picture!
  • EV in 2022 and Beyond: More Good News, but Uncertainties Too
  • What will happen to Zoom?
  • If Facebook (Meta) disappeared 3 years from today (in 2025), I will not be surprised
  • Clustered bar chart and stacked barcharts, switch rows/columns, overlap and customize shapes
  • Are we still ignoring data in making covid-related decisions?
  • Do you really need a Power button for an electric car?
  • How to think about the user cases for Blockchains: A whole spectrum of access control
  • The fundamental problem of governance with DApps (Distributed apps)
  • A Great Discussion on International Trade and Blockchain
  • A Fascinating Recount of the US Semiconductor History
  • A Small Innovation, A Big Saving for the Environment
  • Things I learned When Lighting a Fire
  • Zillow’s Failure in Housing Flipping is a Classic Example of Ignoring Bottlenecks and Variabilities
  • How to Revive the Semiconductor Manufacturing Industry in the US
  • What is the Supply Chains of the Future?
  • A Tale of Two Chains: Supply Chain and Blockchain
  • Port of LA: Storage Space is the culprit?
  • Why Additive Manufacturing (or 3D Printing)?
  • Why Supply Chain Delays are Multi-faceted: A Mathematical Explanations (Without the Heavy Math)
  • Green Ammonia is a promising renewable marine fuel
  • EV is not just about making cars. It is about the Supply Chain.
  • Understanding CO2 Emissions for different freight transport modes (renewable as well as non-renewable)
  • The One and Only Michael Dell
  • Tesla Lease Mileage Limit and the Central Limit Theorem
  • Daniel Pink’s “When” is an Illuminating Book Towards High Productivity and Better Living
  • SHOULD I BUY OR LEASE A TESLA? PART 4: It all comes down to your apetities towards risk
  • SHOULD I BUY OR LEASE A TESLA? PART 3: It is not black-and-white (because we do not know the future)
  • SHOULD I BUY OR LEASE A TESLA? PART 2: Total loan cost (when you are sure about the depreciation)
  • Should I Buy or Lease a Tesla? Part 1: Leasing Cost
  • A great article on this thing called “supply chain shortage”
  • How to draw ranking data properly
  • Simulation: Is demand equal to sales? (Part II, and why is there a Loch Ness Monster?)
  • Simulation: Is demand equal to sales? (Part I)
  • Simulation: It all starts with a coin toss
  • Carbon foot-printing problem is first of all an information problem
  • Last-mile Transport is the Key Driver in Supply Chain Carbon Footprint
  • Elon Musk Gets Manufacturing
  • Road Transportation is the Single Largest Decarbonization Opportunity with a Clear Path Forward
  • Carbon Foot printing: Devil is in its details…
  • The Sustainability Perils of E-commerce (II): Fast and Furious (Fuming)?
  • Excel Pivot Table Trick: Drawing Charts Using Only Part of the Pivot Table
  • The Carbon-reducing Effect of E-commerce Delivery
  • The sustainability peril of E-commerce (I): Small batches lead to more emissions
  • Two-way Data Table in Excel is a great tool for sensitivity analysis
  • The Dawn of the Modern Power Grid Started Right Here in Massachusetts (and It was Clean Energy!)
  • Measuring the Carbon Footprint of a Supply Chain: 3 Scopes
  • Zero-Carbon Economy: A Grand -and Necessary – Vision
  • More power lines, or rooftop solar panels? There is no easy answer (but here is a way to think about it)
  • ICCT’s Report on the Lifecycle Comparisons of GHG Emissions of Gas Cars vs. EV is Filling a Void
  • The Most Factual and Poignant Article on the Failure on COVID Data Collection and Interpretation (So Far)
  • Modeling Driving Distances (3)
  • Modeling Driving Distances (2)
  • Modeling Driving Distances (1)
  • Digital Technology and Clean Energy
  • Range Anxiety for Electric Vehicles (EV) – Part I
  • Small change in mean can result in big change in extremes
  • Why Hasn’t Anybody Done This Graph about COVID-19?
  • Wow What a Great Data Site
  • Excel Shortcut Keys (2020 Edition)
  • How to Provide Electricity Access to Rural Africa: An Example
  • Why is Chick-Fil-A Picking up Market Share (and Why is McDonalds Testing Robot Fryers and Voice-Activated Drive-Through)?
  • Filter Data Right in your Pivot Table Fields!
  • Sensitivity Study (or Scenarios) with Data Table
  • PivotTable: Calculated Fields
  • Dashboard with PivotTable
  • Data Slicer and Timeline are Useful Reporting Tools in PivotTable
  • How to Draw a Combo Chart, i.e. Chart with 2 Y-axis, and Change Chart Type on a Mac
  • How much gasoline do we American consumers buy each week? An Example of Excel Modeling
  • Most Used Excel Shortcut Keys – Mac and PC
  • How to Draw a 3-D Chart
  • Chance of Nothing Happening? The Power of Joint Probabilities
  • This Site Has Abundant Climate Data
  • Here is Another Example on Why Excel will Never Go Away – Julia Computing
  • Tesla Needs to Be More Rigorous in Discussing Numbers
  • What (and when) are the most popular US cities to visit?
  • Google Sheets is Catching up with Excel in Charting
  • What is Your Favorite Data Source?
  • All Great Boston Area Towns Benefitting from the Housing Boom? Not Quite So
  • How Advance do People Make Rental Car Reservations? The Result May Surprise You!
  • How to Estimate Uber’s Monthly Ride Volume in 3 steps
  • How to Draw a Pareto Chart?
  • Sparkline (aka chart-in-a cell) really sparkles!
  • Data Table is a Secret Weapon in Excel Modeling and Analysis
  • “That’s twice the size of Texas. They may never find us.”
  • The New Histogram Tool in Excel 2016 is Handy-Dandy
  • To build a frequency distribution chart, do NOT use Excel’s Histogram add-in tool
  • Flashfill in one of my favorite new feature in Excel
  • Excel Tutorial: How to Load Solver in Excel (Mac)
  • How to calculate Time Difference in Excel
  • You Draw It: How Family Income Affects Children’s College Chances
ExcelProf.com

©2018 Excelprof.com All Rights Reserved.

Facebook