Category
analytics
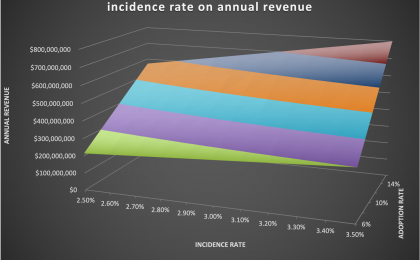
Two-way Data Table in Excel is a great tool for sensitivity analysis
In an earlier post, I have introduced Data Table as a “secret weapon” to conduct sensitivity analysis. Now let’s go one step further and look at a more...


The Most Factual and Poignant Article on the Failure on COVID Data Collection and Interpretation (So Far)
Today, WSJ published a scathing opinion piece by Dr. Marty Makary from Johns Hopkins University titled “The Flimsy Evidence Behind the CDC’s Push to Vaccinate Children:...

Modeling Driving Distances (3)
Since my last post on using NTHS dataset to fit people’s driving distances, I have made some further modifications: (1) There are some very large TRPMILE data values, in...

Modeling Driving Distances (2)
The National Household Travel Survey (NHTS) is probably the most comprehensive data source on driving behaviors of people in the US. It captures travel by US residents in all...
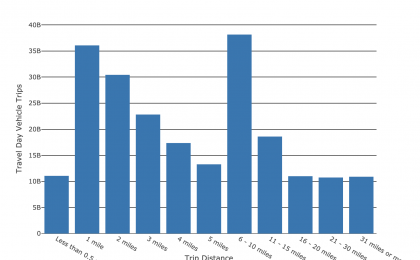
Modeling Driving Distances (1)
In order to qualitatively study range anxiety, one of the first steps is to understand people’s driving behavior. A basic question is: What is the statistical...
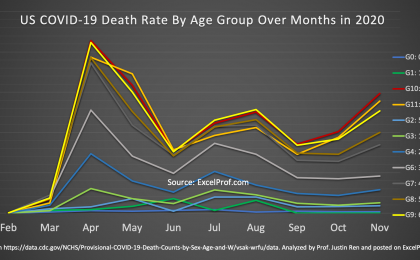
Why Hasn’t Anybody Done This Graph about COVID-19?
The COVID-19 pandemic has been going on for over 9 months now (I am writing this in mid-December of 2020). One question that I have always been thinking about: Has the risk of...

Wow What a Great Data Site
Recently I came across a beautiful data analytics website while I was reading on why renewable energy is showing greater and greater momentum in replacing traditional fossil...