Scenario analysis (also called What-ifs) is an indispensable part of business decision models. What is demand is only half of predicted? What if conversion rate is 50% higher? What if we drop our inventory by 1000 units? Once a decision model is built, it helps decision makers to test outcomes under various scenarios. Excel provides a very convenient tool called Data Table for this purpose.
Take a look at this example video:
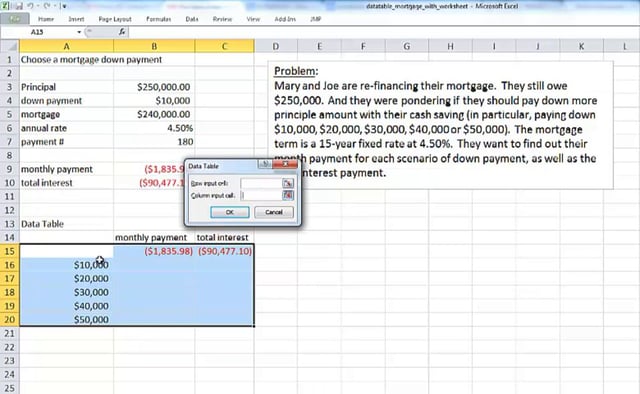
In this example, mortgage payment is computed as a function of down payment and other variables such as interest rate and number of payment. The model user is interested in studying what happens to monthly payment and interest payment if he/she increases down payment from $10,000 to $20,000, $30,000,…
As is shown in the video, in just a few mouse clicks one can come up with a complete table detailing results in each scenario.
What is more, Data Table can simultaneously study the joint effect of two variables. We will look at this two-way Data Table in another post.
What have you done with Data Table? Share your thoughts and comments below?